Слайды и текст этой презентации
Слайд 1

Описание слайда:
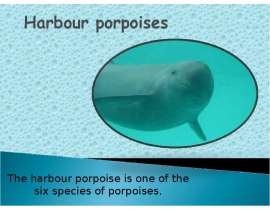
Are Russians healthy people?
How does Russia rank in the world?
Слайд 2

Описание слайда:
Do you know these words?
Advantages and disadvantages
Public health care system
Compulsory health insurance
be available
in advance
make an appointment
examine properly
be overworked
properly
GPs
Shortage of money
Life expectancy
Слайд 3
Описание слайда:
Do you know these words?
Infant mortality
Heart diseases
Respiratory diseases
Infectious diseases
Cancer
AIDS cases
Immunization
Healthy lifestyle
To rank (highly, low)
Public health programmes
To get better (worse)
Coverage
Drinking, smoking, drug usage
Слайд 4
Описание слайда:
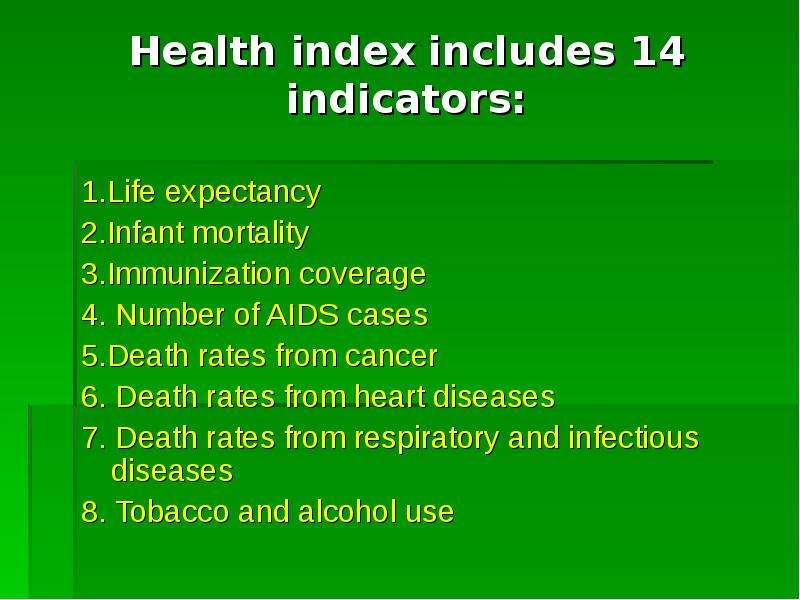
Health index includes 14 indicators:
1.Life expectancy
2.Infant mortality
3.Immunization coverage
4. Number of AIDS cases
5.Death rates from cancer
6. Death rates from heart diseases
7. Death rates from respiratory and infectious diseases
8. Tobacco and alcohol use
Слайд 5
Описание слайда:
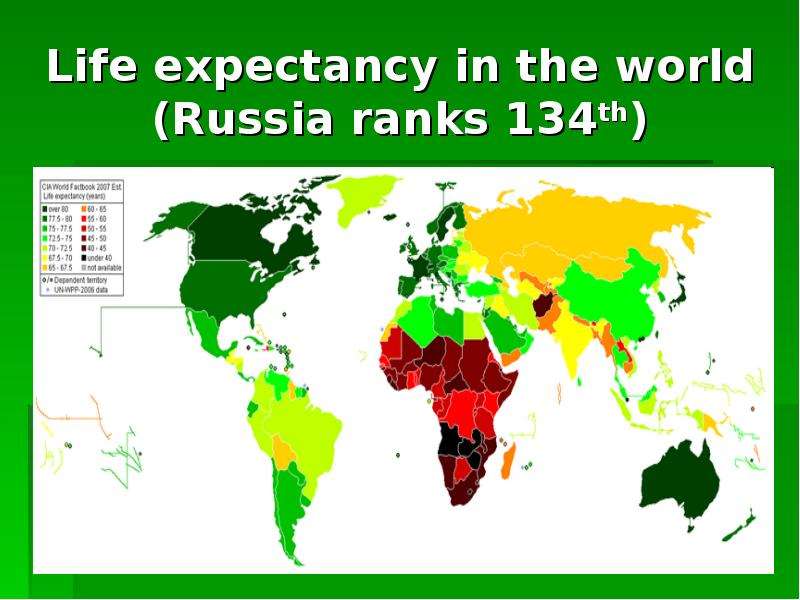
Life expectancy in the world
(Russia ranks 134th)
Слайд 6
Описание слайда:
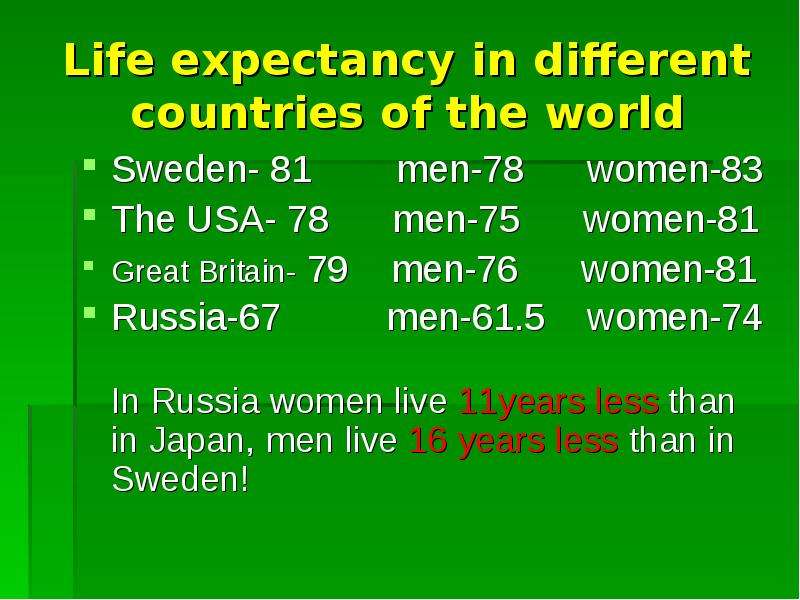
Life expectancy in different countries of the world
Sweden- 81 men-78 women-83
The USA- 78 men-75 women-81
Great Britain- 79 men-76 women-81
Russia-67 men-61.5 women-74
In Russia women live 11years less than in Japan, men live 16 years less than in Sweden!
Слайд 7
Описание слайда:
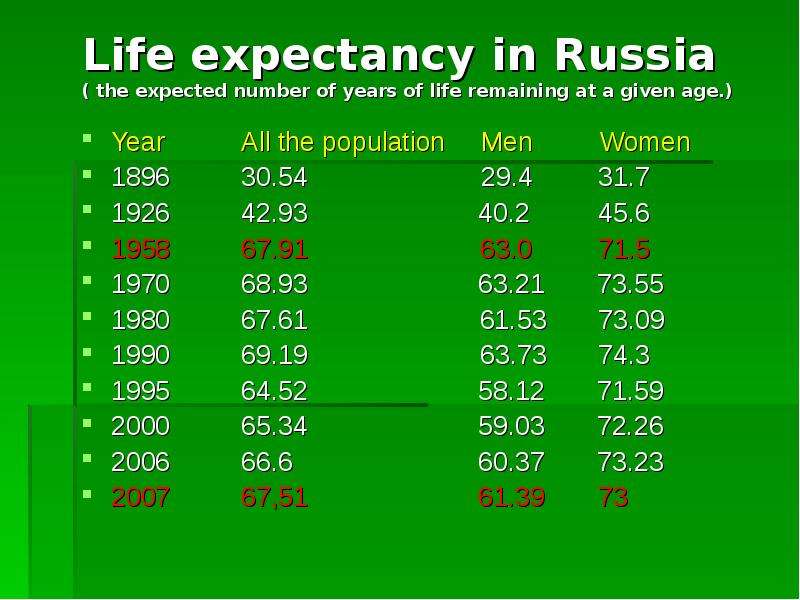
Life expectancy in Russia
( the expected number of years of life remaining at a given age.)
Year All the population Men Women
1896 30.54 29.4 31.7
1926 42.93 40.2 45.6
1958 67.91 63.0 71.5
1970 68.93 63.21 73.55
1980 67.61 61.53 73.09
1990 69.19 63.73 74.3
1995 64.52 58.12 71.59
2000 65.34 59.03 72.26
2006 66.6 60.37 73.23
2007 67,51 61.39 73
Слайд 8
Описание слайда:
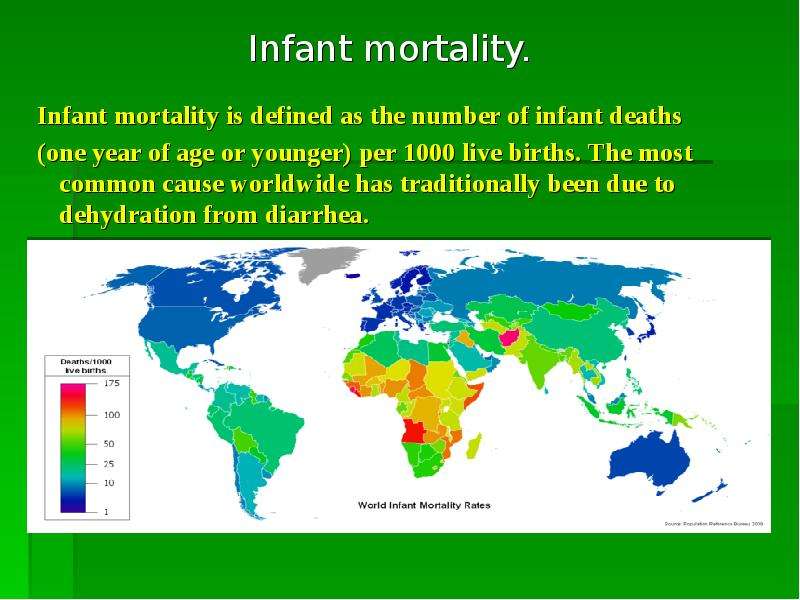
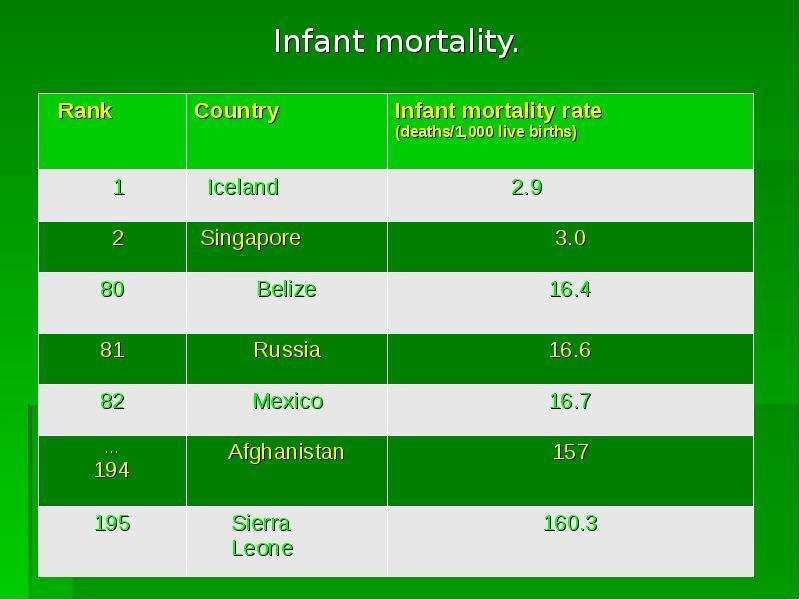
Infant mortality.
Infant mortality is defined as the number of infant deaths
(one year of age or younger) per 1000 live births. The most common cause worldwide has traditionally been due to dehydration from diarrhea.
Слайд 9
Описание слайда:
Infant mortality.
Russia ranks 81st in the world in Infant mortality , between Belize and Mexico.
About 16 children per each 1000 children die.
The reasons of this situation are negative influence of environment, drug and alcohol addiction of parents, poor diets, poor medical service, etc.
Слайд 10
Описание слайда:
Infant mortality.
Слайд 11
Описание слайда:
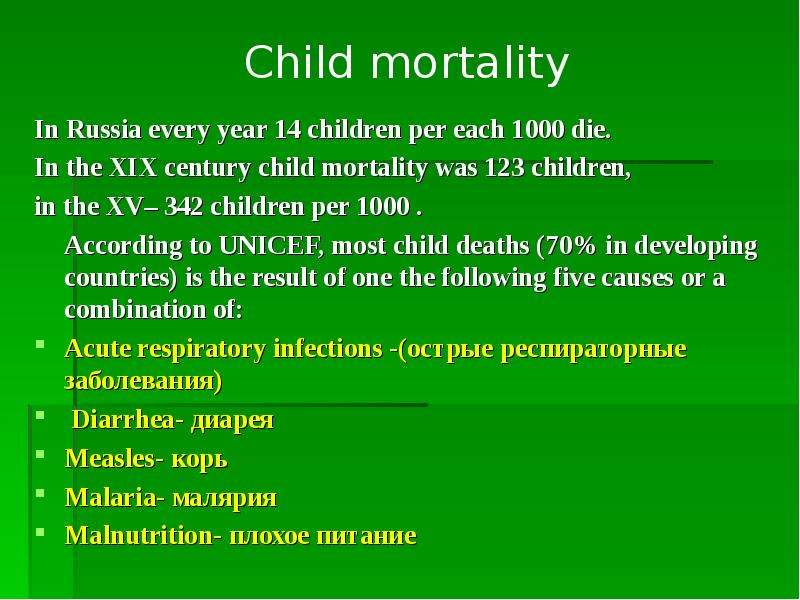
Child mortality
In Russia every year 14 children per each 1000 die.
In the XIX century child mortality was 123 children,
in the XV– 342 children per 1000 .
According to UNICEF, most child deaths (70% in developing countries) is the result of one the following five causes or a combination of:
Acute respiratory infections -(острые респираторные заболевания)
Diarrhea- диарея
Measles- корь
Malaria- малярия
Malnutrition- плохое питание
Слайд 12
Описание слайда:
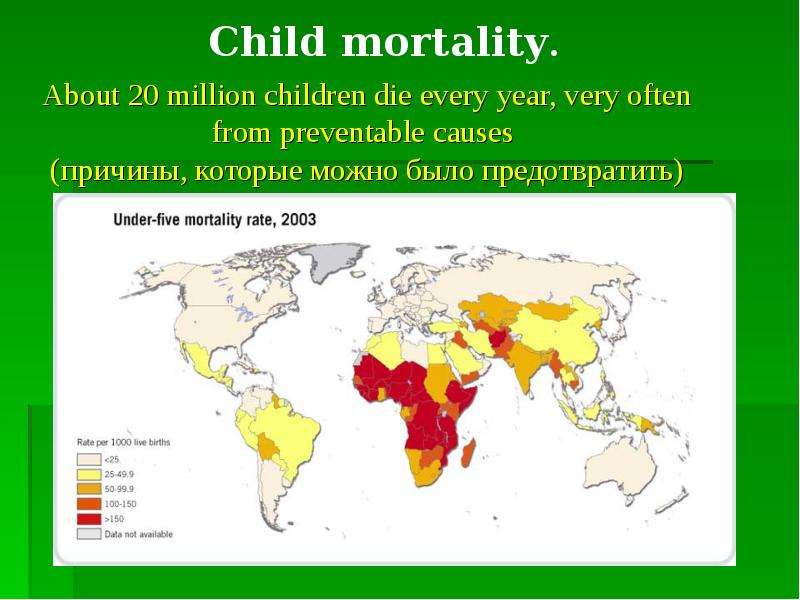
About 20 million children die every year, very often from preventable causes
(причины, которые можно было предотвратить)
Слайд 13

Слайд 14
Описание слайда:
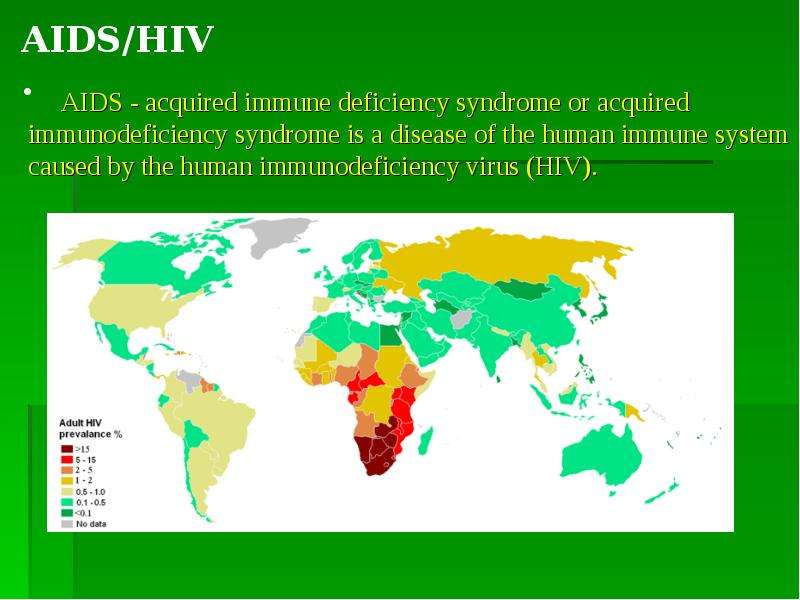
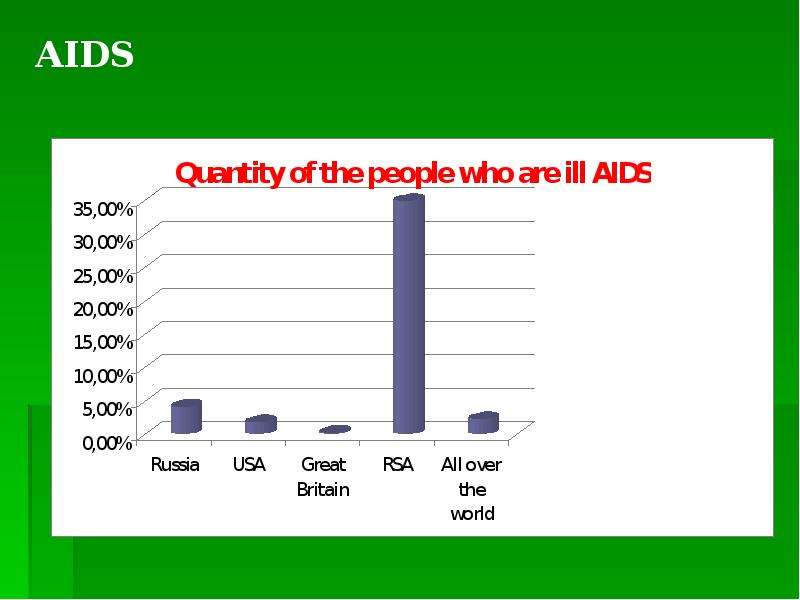
AIDS - acquired immune deficiency syndrome or acquired immunodeficiency syndrome is a disease of the human immune system caused by the human immunodeficiency virus (HIV).
Слайд 15
Слайд 16
Описание слайда:
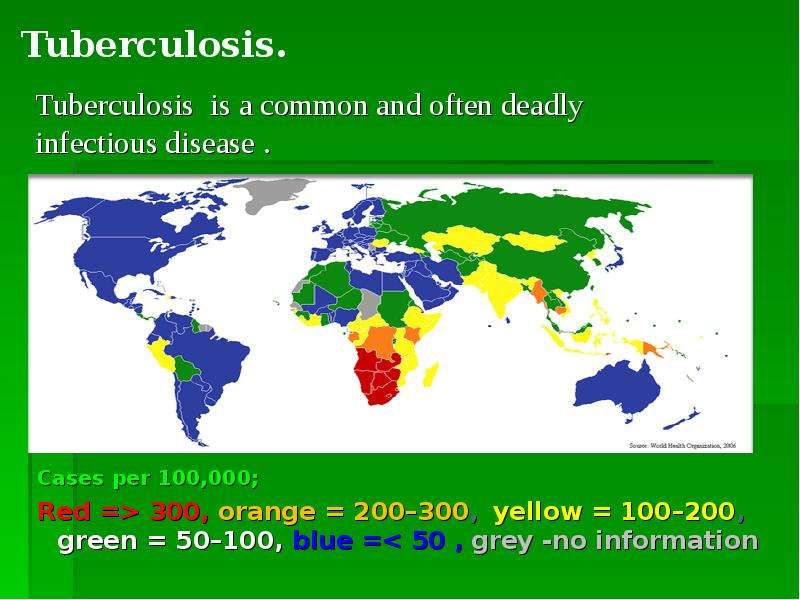
Tuberculosis is a common and often deadly infectious disease .
Cases per 100,000;
Red => 300, orange = 200–300, yellow = 100–200, green = 50–100, blue =< 50 , grey -no information
Слайд 17
Описание слайда:
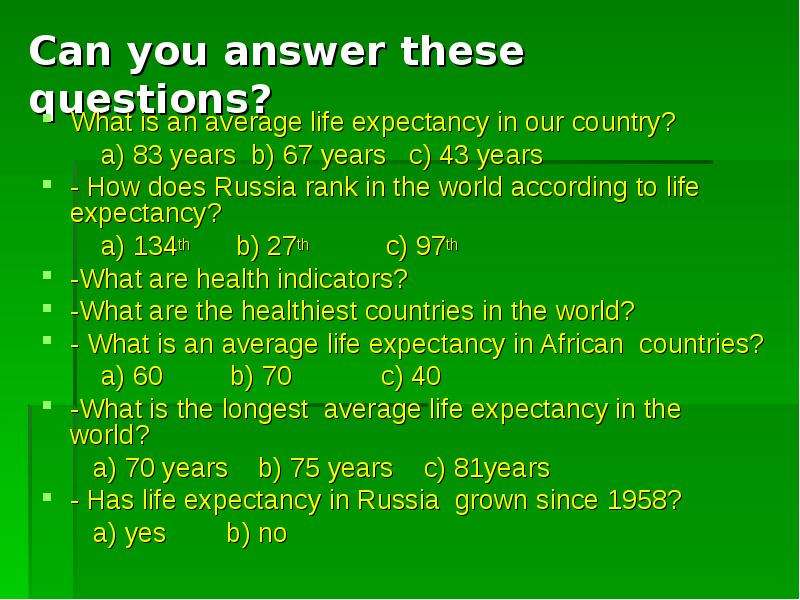
Can you answer these questions?
What is an average life expectancy in our country?
a) 83 years b) 67 years c) 43 years
- How does Russia rank in the world according to life expectancy?
a) 134th b) 27th c) 97th
-What are health indicators?
-What are the healthiest countries in the world?
- What is an average life expectancy in African countries?
a) 60 b) 70 c) 40
-What is the longest average life expectancy in the world?
a) 70 years b) 75 years c) 81years
- Has life expectancy in Russia grown since 1958?
a) yes b) no
Презентацию на
тему Проблемы продолжительности жизни в разных странах можно скачать бесплатно ниже: