🗊Презентация Energy and power, solar astronomy. (Lecture 4)

Категория: Астрономия
Нажмите для полного просмотра!
Energy and power, solar astronomy. (Lecture 4), слайд №1Energy and power, solar astronomy. (Lecture 4), слайд №2Energy and power, solar astronomy. (Lecture 4), слайд №3Energy and power, solar astronomy. (Lecture 4), слайд №4Energy and power, solar astronomy. (Lecture 4), слайд №5Energy and power, solar astronomy. (Lecture 4), слайд №6Energy and power, solar astronomy. (Lecture 4), слайд №7Energy and power, solar astronomy. (Lecture 4), слайд №8Energy and power, solar astronomy. (Lecture 4), слайд №9Energy and power, solar astronomy. (Lecture 4), слайд №10Energy and power, solar astronomy. (Lecture 4), слайд №11Energy and power, solar astronomy. (Lecture 4), слайд №12Energy and power, solar astronomy. (Lecture 4), слайд №13Energy and power, solar astronomy. (Lecture 4), слайд №14Energy and power, solar astronomy. (Lecture 4), слайд №15Energy and power, solar astronomy. (Lecture 4), слайд №16Energy and power, solar astronomy. (Lecture 4), слайд №17Energy and power, solar astronomy. (Lecture 4), слайд №18Energy and power, solar astronomy. (Lecture 4), слайд №19Energy and power, solar astronomy. (Lecture 4), слайд №20Energy and power, solar astronomy. (Lecture 4), слайд №21Energy and power, solar astronomy. (Lecture 4), слайд №22Energy and power, solar astronomy. (Lecture 4), слайд №23Energy and power, solar astronomy. (Lecture 4), слайд №24Energy and power, solar astronomy. (Lecture 4), слайд №25Energy and power, solar astronomy. (Lecture 4), слайд №26Energy and power, solar astronomy. (Lecture 4), слайд №27Energy and power, solar astronomy. (Lecture 4), слайд №28Energy and power, solar astronomy. (Lecture 4), слайд №29Energy and power, solar astronomy. (Lecture 4), слайд №30Energy and power, solar astronomy. (Lecture 4), слайд №31Energy and power, solar astronomy. (Lecture 4), слайд №32Energy and power, solar astronomy. (Lecture 4), слайд №33Energy and power, solar astronomy. (Lecture 4), слайд №34Energy and power, solar astronomy. (Lecture 4), слайд №35Energy and power, solar astronomy. (Lecture 4), слайд №36Energy and power, solar astronomy. (Lecture 4), слайд №37Energy and power, solar astronomy. (Lecture 4), слайд №38Energy and power, solar astronomy. (Lecture 4), слайд №39Energy and power, solar astronomy. (Lecture 4), слайд №40Energy and power, solar astronomy. (Lecture 4), слайд №41Energy and power, solar astronomy. (Lecture 4), слайд №42Energy and power, solar astronomy. (Lecture 4), слайд №43Energy and power, solar astronomy. (Lecture 4), слайд №44Energy and power, solar astronomy. (Lecture 4), слайд №45Energy and power, solar astronomy. (Lecture 4), слайд №46Energy and power, solar astronomy. (Lecture 4), слайд №47Energy and power, solar astronomy. (Lecture 4), слайд №48Energy and power, solar astronomy. (Lecture 4), слайд №49Energy and power, solar astronomy. (Lecture 4), слайд №50Energy and power, solar astronomy. (Lecture 4), слайд №51Energy and power, solar astronomy. (Lecture 4), слайд №52Energy and power, solar astronomy. (Lecture 4), слайд №53Energy and power, solar astronomy. (Lecture 4), слайд №54

Содержание
Вы можете ознакомиться и скачать презентацию на тему Energy and power, solar astronomy. (Lecture 4). Доклад-сообщение содержит 54 слайдов. Презентации для любого класса можно скачать бесплатно. Если материал и наш сайт презентаций Mypresentation Вам понравились – поделитесь им с друзьями с помощью социальных кнопок и добавьте в закладки в своем браузере.
Слайды и текст этой презентации


Слайд 1


IE350 
Alternate Energy Course
Lecture # 4
Energy and Power, 
Solar Astronomy
Описание слайда:
IE350 Alternate Energy Course Lecture # 4 Energy and Power, Solar Astronomy

Слайд 2


Energy Units - Calorie
Calorie (cal) = heat to increase by 1°C the 1 gram of water.
1 cal ≈ 4.184 Joules
Описание слайда:
Energy Units - Calorie Calorie (cal) = heat to increase by 1°C the 1 gram of water. 1 cal ≈ 4.184 Joules

Слайд 3


Very Small Energy Unit, eV
Electronvolt (eV) - the amount of kinetic energy gained by a single unbound electron when it passes through an electrostatic potential difference of one volt, in vacuum.
Описание слайда:
Very Small Energy Unit, eV Electronvolt (eV) - the amount of kinetic energy gained by a single unbound electron when it passes through an electrostatic potential difference of one volt, in vacuum.

Слайд 4


Energy unit conversion factors
Описание слайда:
Energy unit conversion factors

Слайд 5


Energy and Power 

 If power is constant
E = P · t,     P = E/t
 If power is variable and depends on time
E = ∫P(t)dt,      P(t) = dE(t)/dt
Описание слайда:
Energy and Power If power is constant E = P · t, P = E/t If power is variable and depends on time E = ∫P(t)dt, P(t) = dE(t)/dt

Слайд 6


Power Units
Watt (W) = using one J in one second.
kW = 1000 W
Horsepower 	= 735 W 
				= 0.735 kW
MW = 1000 kW
Описание слайда:
Power Units Watt (W) = using one J in one second. kW = 1000 W Horsepower = 735 W = 0.735 kW MW = 1000 kW

Слайд 7


Power vs. Energy
Thus, power is the rate of the energy use.
Energy is what you pay for repeatedly, as much as you use the energy, the kWh-s – variable, operational cost.
Power is the capacity to use the energy
You pay for the capacity usually upfront, fixed or installation cost.
E.g. if you decide to buy an air conditioner, you need to solve a power sizing problem. You pay the fixed amount.  Later you usually use only a fraction of the total capacity.
Описание слайда:
Power vs. Energy Thus, power is the rate of the energy use. Energy is what you pay for repeatedly, as much as you use the energy, the kWh-s – variable, operational cost. Power is the capacity to use the energy You pay for the capacity usually upfront, fixed or installation cost. E.g. if you decide to buy an air conditioner, you need to solve a power sizing problem. You pay the fixed amount. Later you usually use only a fraction of the total capacity.

Слайд 8


Solar Energy
The SUN:
Fusion in the sun – the process
Temperature of the suncrust, black-body radiation – BBR
Photon energy, light speed, duality
Electromagnetic Spectrum
The solar radiation spectrum
Solar constant = 1366 W/m2.
Описание слайда:
Solar Energy The SUN: Fusion in the sun – the process Temperature of the suncrust, black-body radiation – BBR Photon energy, light speed, duality Electromagnetic Spectrum The solar radiation spectrum Solar constant = 1366 W/m2.

Слайд 9


The light: particle, wave
Particle and wave
Light speed, 	c = 299,792,458 m/s 
			c ≈ 300,000 km/s
Photon energy, E = h= frequency, 
h is Planck’s constant, h = 6.626 10-34 J s 				h = 4.135 10-15 eV s.
  = c/
E = hc/
Описание слайда:
The light: particle, wave Particle and wave Light speed, c = 299,792,458 m/s c ≈ 300,000 km/s Photon energy, E = h= frequency, h is Planck’s constant, h = 6.626 10-34 J s h = 4.135 10-15 eV s.  = c/ E = hc/

Слайд 10


Electromagnetic Spectrum
Описание слайда:
Electromagnetic Spectrum

Слайд 11


Sun Spectrum
Описание слайда:
Sun Spectrum

Слайд 12


The Sun
Sun has a capacity of 	3.86×1026 W
					3.86×10⁸ EJ/s
Earth gets only two-billionth part of it.
127,400,000 km²  - Earth cross-section
1.740 1017 W = 0.174 EJ/s
Armenian annual energy consumption: 
0.1752 Quads
Solar Constant 		=1366 W/sq.m.
Average Insolation 	= ¼ of solar const.
					= 342 W/sq.m.
Описание слайда:
The Sun Sun has a capacity of 3.86×1026 W 3.86×10⁸ EJ/s Earth gets only two-billionth part of it. 127,400,000 km² - Earth cross-section 1.740 1017 W = 0.174 EJ/s Armenian annual energy consumption: 0.1752 Quads Solar Constant =1366 W/sq.m. Average Insolation = ¼ of solar const. = 342 W/sq.m.

Слайд 13


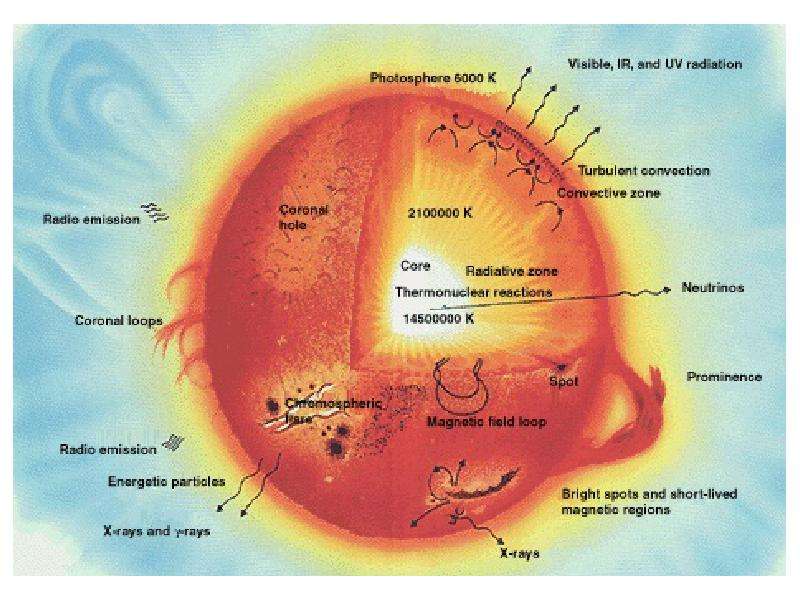
How this energy is generated?
Описание слайда:
How this energy is generated?

Слайд 14


How this energy is generated?
About 74% of the Sun's mass is hydrogen, 25% is helium, and the rest is made up of trace quantities of heavier elements.
Описание слайда:
How this energy is generated? About 74% of the Sun's mass is hydrogen, 25% is helium, and the rest is made up of trace quantities of heavier elements.

Слайд 15


How this energy is generated?
The Sun has a surface temperature of approximately 5,500 K, giving it a white color, which, because of atmospheric scattering, appears yellow.
Описание слайда:
How this energy is generated? The Sun has a surface temperature of approximately 5,500 K, giving it a white color, which, because of atmospheric scattering, appears yellow.

Слайд 16


How this energy is generated?
The Sun diameter:
1.4 106 km = 109 that of the earth.
Distance from Earth:
1.5 108 km, = 8.31 min at light speed
Описание слайда:
How this energy is generated? The Sun diameter: 1.4 106 km = 109 that of the earth. Distance from Earth: 1.5 108 km, = 8.31 min at light speed

Слайд 17


How this energy is generated?
It was Albert Einstein who provided the essential clue to the source of the Sun's energy output with his mass-energy relation: 			E=mc²
Описание слайда:
How this energy is generated? It was Albert Einstein who provided the essential clue to the source of the Sun's energy output with his mass-energy relation: E=mc²

Слайд 18


Energy and power, solar astronomy. (Lecture 4), слайд №18
Описание слайда:

Слайд 19


Energy and power, solar astronomy. (Lecture 4), слайд №19
Описание слайда:

Слайд 20


The Sun
Описание слайда:
The Sun

Слайд 21


Energy and power, solar astronomy. (Lecture 4), слайд №21
Описание слайда:

Слайд 22


Energy and power, solar astronomy. (Lecture 4), слайд №22
Описание слайда:

Слайд 23


Energy and power, solar astronomy. (Lecture 4), слайд №23
Описание слайда:

Слайд 24


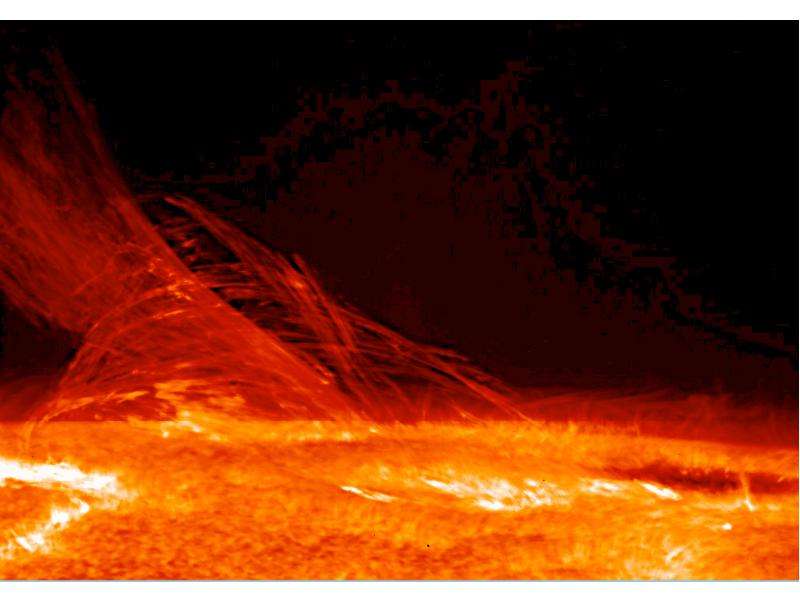
NASA caption: Giant magnetic loops dance on the sun’s horizon in concert with the eruption of a solar flare—seen as a bright flash of light—in this imagery from NASA’s Solar Dynamics Observatory, captured Jan. 12-13, 2015. Image Credit: NASA/SDO
Описание слайда:
NASA caption: Giant magnetic loops dance on the sun’s horizon in concert with the eruption of a solar flare—seen as a bright flash of light—in this imagery from NASA’s Solar Dynamics Observatory, captured Jan. 12-13, 2015. Image Credit: NASA/SDO

Слайд 25


Energy and power, solar astronomy. (Lecture 4), слайд №25
Описание слайда:

Слайд 26


Energy and power, solar astronomy. (Lecture 4), слайд №26
Описание слайда:

Слайд 27


Energy and power, solar astronomy. (Lecture 4), слайд №27
Описание слайда:

Слайд 28


Sun surface videos
https://www.youtube.com/watch?v=ipvfwPqh3V4
https://www.youtube.com/watch?v=0WW1HN0iG0M
https://www.youtube.com/watch?v=lpzCSZ7Eerc
https://www.youtube.com/watch?v=nmDZhQAIeXM
Описание слайда:
Sun surface videos https://www.youtube.com/watch?v=ipvfwPqh3V4 https://www.youtube.com/watch?v=0WW1HN0iG0M https://www.youtube.com/watch?v=lpzCSZ7Eerc https://www.youtube.com/watch?v=nmDZhQAIeXM

Слайд 29


Solar wind
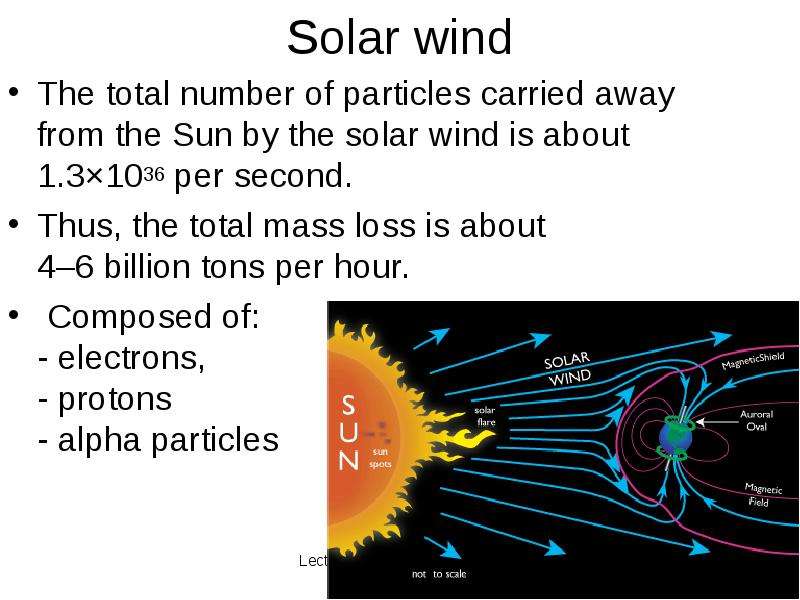
The total number of particles carried away from the Sun by the solar wind is about 1.3×1036 per second.
Thus, the total mass loss is about 
4–6 billion tons per hour.
 Composed of:
- electrons, 
- protons 
- alpha particles
Описание слайда:
Solar wind The total number of particles carried away from the Sun by the solar wind is about 1.3×1036 per second. Thus, the total mass loss is about 4–6 billion tons per hour. Composed of: - electrons, - protons - alpha particles

Слайд 30


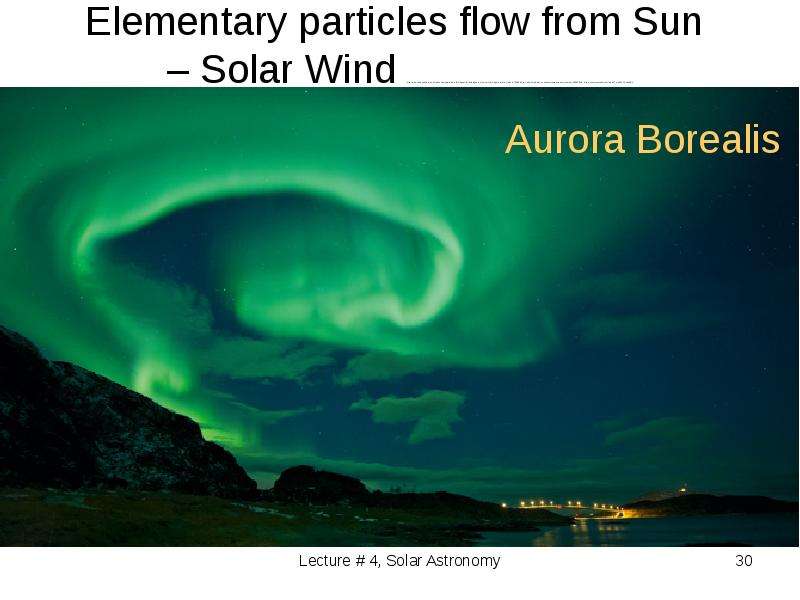
Elementary particles flow from Sun 
– Solar Wind http://www.independent.co.uk/travel/europe/watch-this-beautiful-timelapse-of-the-northern-lights-over-norway-9735690.html  http://www.bbc.com/news/science-environment-28690559   https://www.youtube.com/watch?v=sBWPCvdv8Bk
Описание слайда:
Elementary particles flow from Sun – Solar Wind http://www.independent.co.uk/travel/europe/watch-this-beautiful-timelapse-of-the-northern-lights-over-norway-9735690.html http://www.bbc.com/news/science-environment-28690559 https://www.youtube.com/watch?v=sBWPCvdv8Bk

Слайд 31


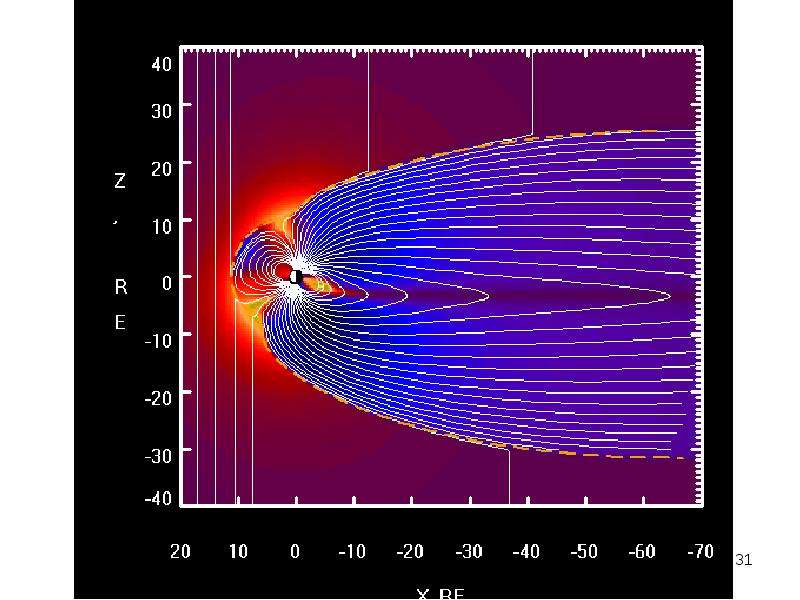
Solar Wind
Описание слайда:
Solar Wind

Слайд 32


Aurora Borealis
https://www.youtube.com/watch?v=hsMW7zbzsUs
https://www.youtube.com/watch?v=Vdb9IndsSXk
https://www.youtube.com/watch?v=pjgvGiEHlNs
Описание слайда:
Aurora Borealis https://www.youtube.com/watch?v=hsMW7zbzsUs https://www.youtube.com/watch?v=Vdb9IndsSXk https://www.youtube.com/watch?v=pjgvGiEHlNs

Слайд 33


How this energy is generated?
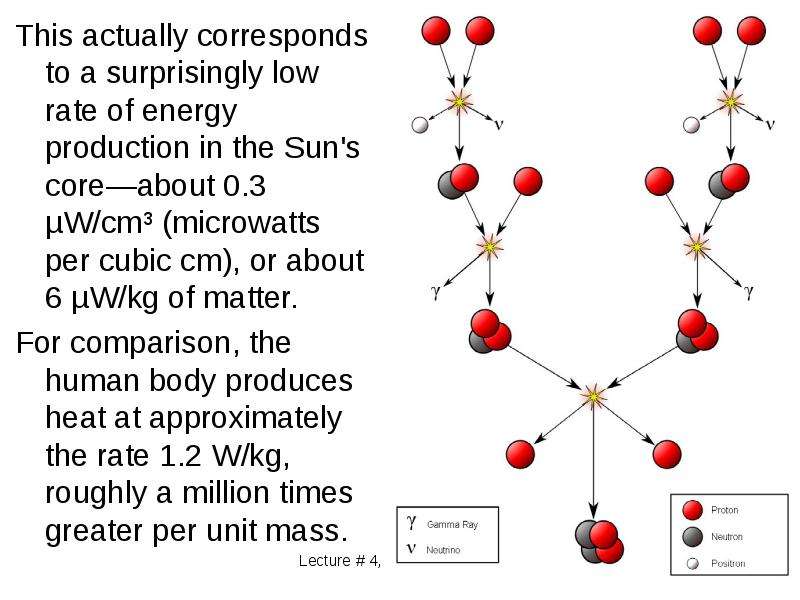
In 1920 Sir Arthur Eddington proposed that the pressures and temperatures at the core of the Sun could produce a nuclear fusion reaction that merged hydrogen into helium, resulting in a production of energy from the net change in mass.
Описание слайда:
How this energy is generated? In 1920 Sir Arthur Eddington proposed that the pressures and temperatures at the core of the Sun could produce a nuclear fusion reaction that merged hydrogen into helium, resulting in a production of energy from the net change in mass.

Слайд 34


This actually corresponds to a surprisingly low rate of energy production in the Sun's core—about 0.3 µW/cm³ (microwatts per cubic cm), or about 6 µW/kg of matter. 
For comparison, the human body produces heat at approximately the rate 1.2 W/kg, roughly a million times greater per unit mass.
Описание слайда:
This actually corresponds to a surprisingly low rate of energy production in the Sun's core—about 0.3 µW/cm³ (microwatts per cubic cm), or about 6 µW/kg of matter. This actually corresponds to a surprisingly low rate of energy production in the Sun's core—about 0.3 µW/cm³ (microwatts per cubic cm), or about 6 µW/kg of matter. For comparison, the human body produces heat at approximately the rate 1.2 W/kg, roughly a million times greater per unit mass.

Слайд 35


Energy and power, solar astronomy. (Lecture 4), слайд №35
Описание слайда:

Слайд 36


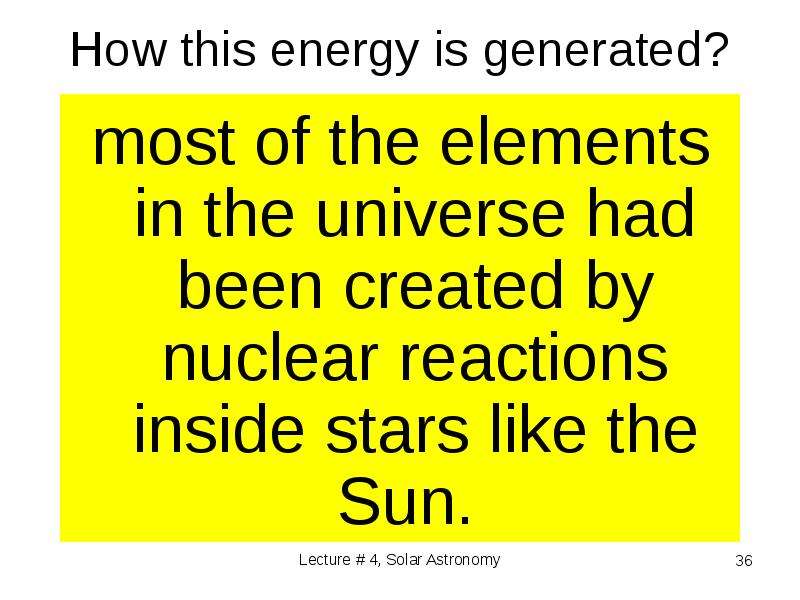
How this energy is generated?
Описание слайда:
How this energy is generated?

Слайд 37


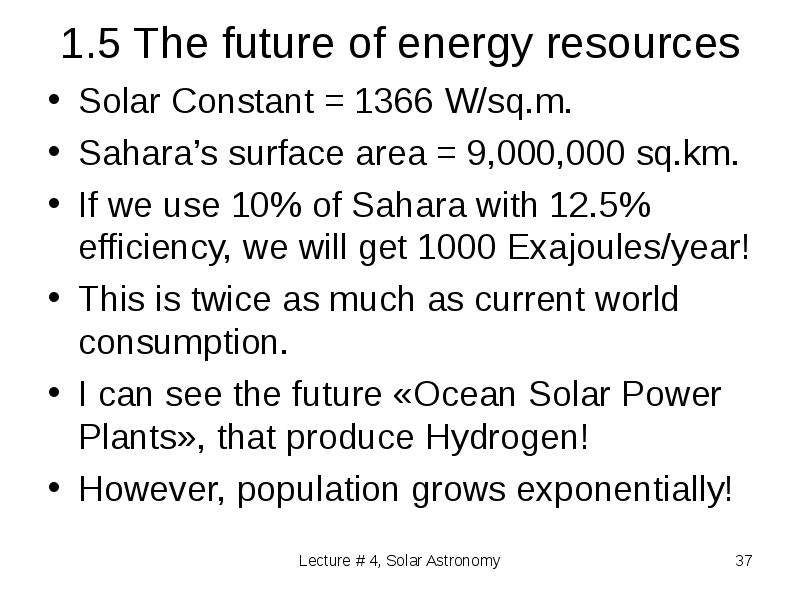
1.5 The future of energy resources
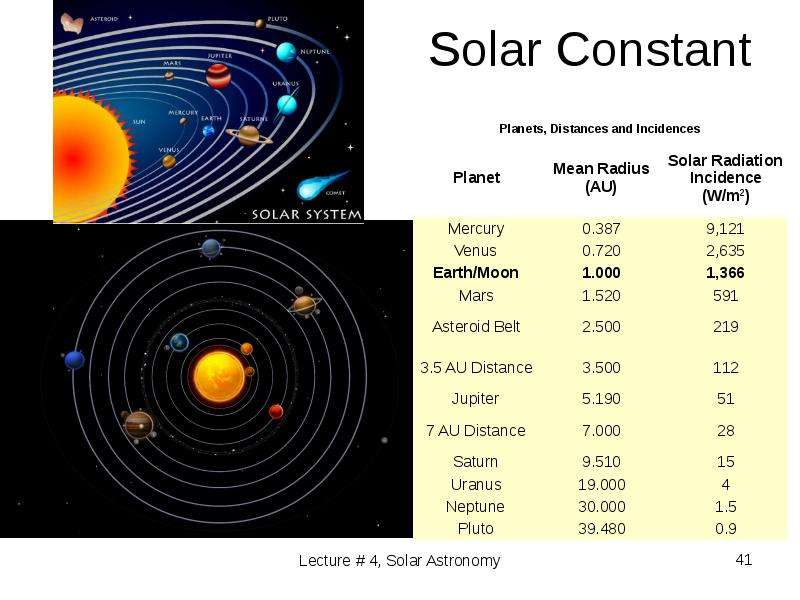
Solar Constant = 1366 W/sq.m.
Sahara’s surface area = 9,000,000 sq.km.
If we use 10% of Sahara with 12.5% efficiency, we will get 1000 Exajoules/year!
This is twice as much as current world consumption.
I can see the future «Ocean Solar Power Plants», that produce Hydrogen!
However, population grows exponentially!
Описание слайда:
1.5 The future of energy resources Solar Constant = 1366 W/sq.m. Sahara’s surface area = 9,000,000 sq.km. If we use 10% of Sahara with 12.5% efficiency, we will get 1000 Exajoules/year! This is twice as much as current world consumption. I can see the future «Ocean Solar Power Plants», that produce Hydrogen! However, population grows exponentially!

Слайд 38


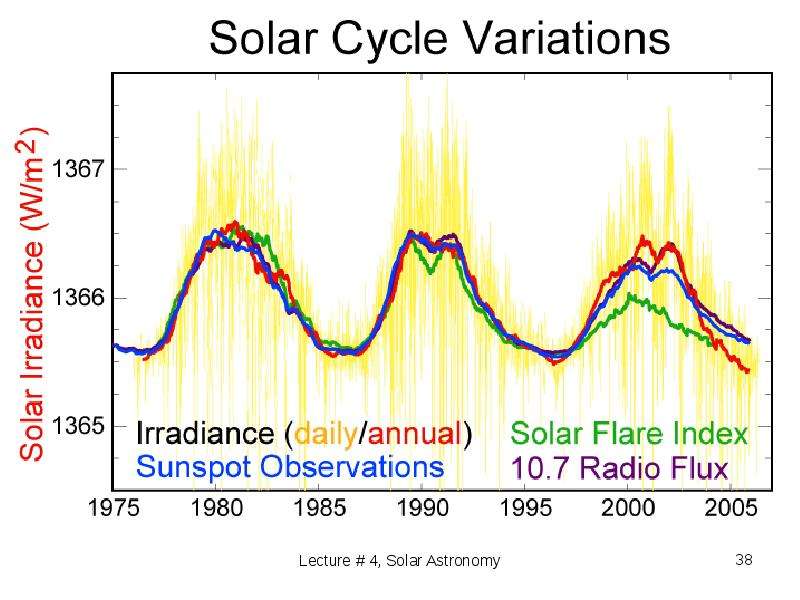
Energy and power, solar astronomy. (Lecture 4), слайд №38
Описание слайда:

Слайд 39


Earth's rotation 
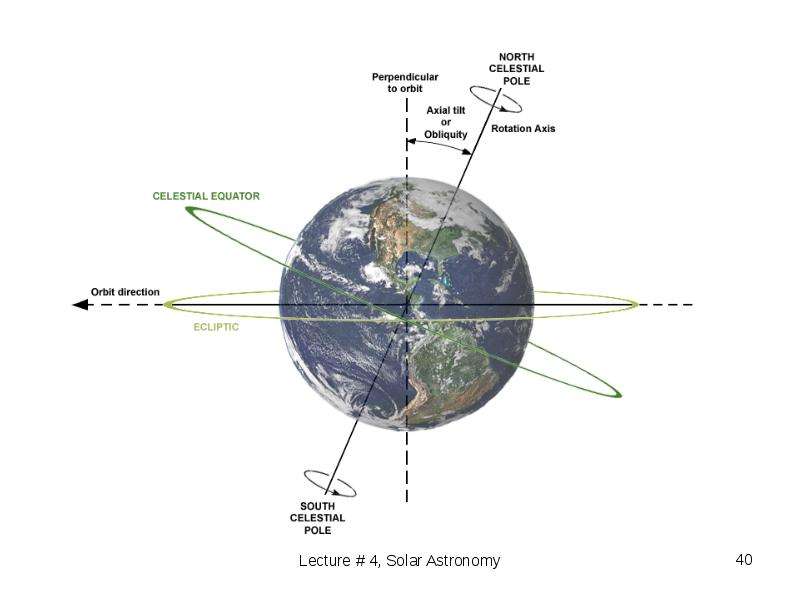
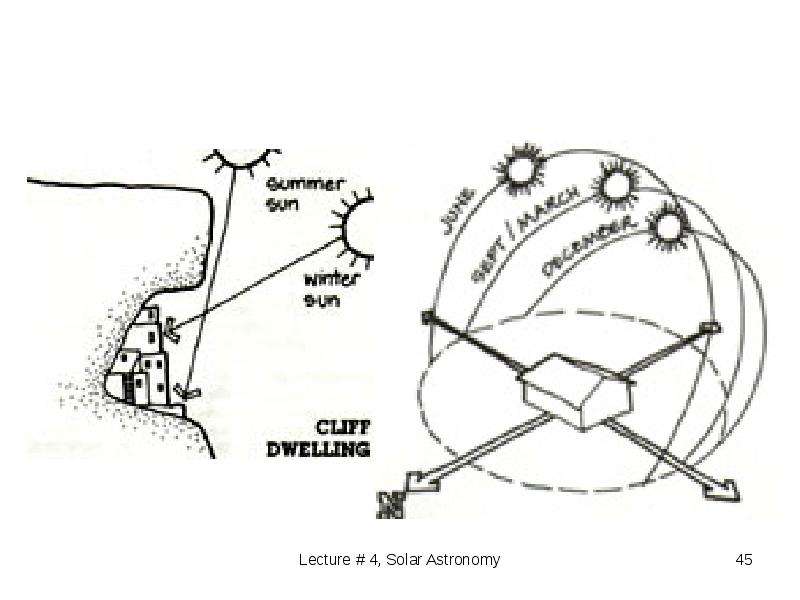
Earth's rotation tilts about 23.5 degrees on its pole-to-pole axis, relative to the plane of Earth's solar system orbit around our sun. 
As the Earth orbits the sun, this creates the 47-degree peak solar altitude angle difference, and the hemisphere-specific difference between summer and winter.
Описание слайда:
Earth's rotation Earth's rotation tilts about 23.5 degrees on its pole-to-pole axis, relative to the plane of Earth's solar system orbit around our sun. As the Earth orbits the sun, this creates the 47-degree peak solar altitude angle difference, and the hemisphere-specific difference between summer and winter.

Слайд 40


Energy and power, solar astronomy. (Lecture 4), слайд №40
Описание слайда:

Слайд 41


Solar Constant
Описание слайда:
Solar Constant

Слайд 42


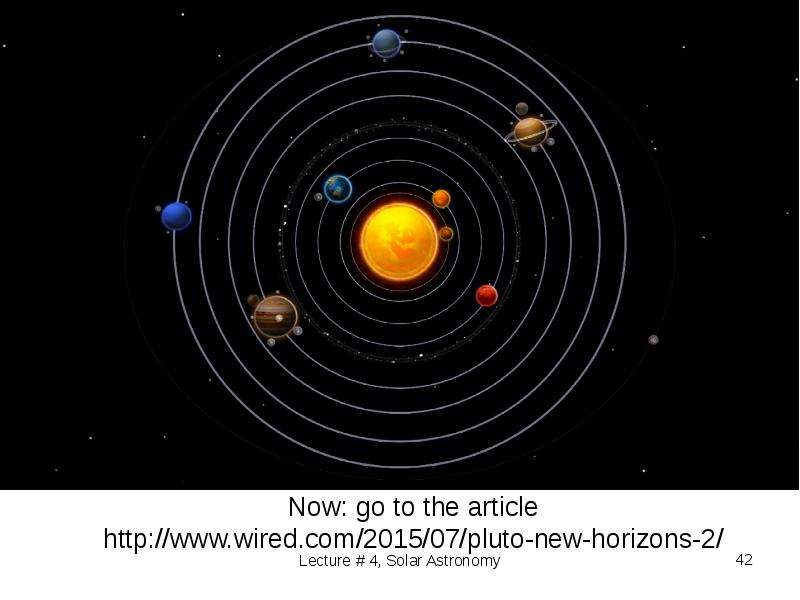
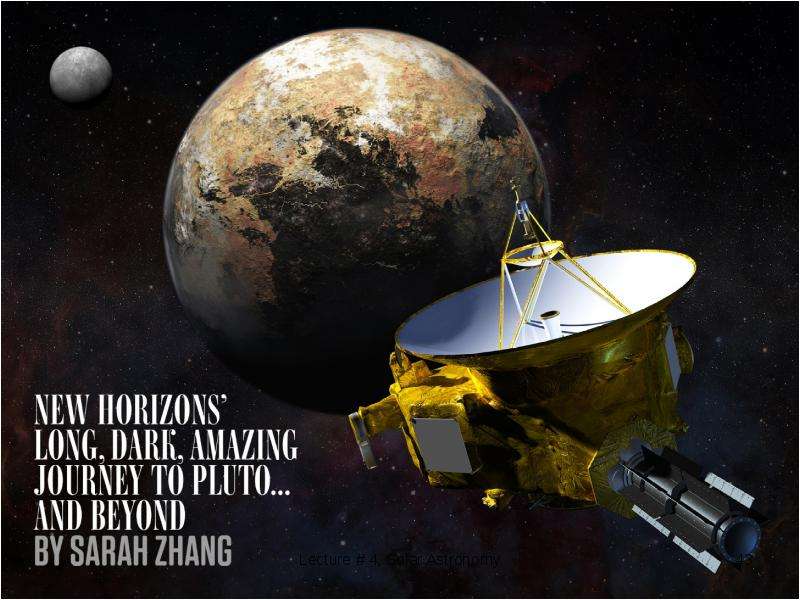
Now: go to the article
http://www.wired.com/2015/07/pluto-new-horizons-2/
Описание слайда:
Now: go to the article http://www.wired.com/2015/07/pluto-new-horizons-2/

Слайд 43


Energy and power, solar astronomy. (Lecture 4), слайд №43
Описание слайда:

Слайд 44


Solar radiation bouncing atmosphere
the theoretical daily-average insolation at the top of the atmosphere, where θ is the polar angle of the Earth's orbit, and θ = 0 at the vernal equinox, and θ = 90° at the summer solstice; φ is the latitude of the Earth. The calculation assumed conditions appropriate for 2000 A.D.: a solar constant of S0 = 1367 W m−2, obliquity of ε = 23.4398°, longitude of perihelion of ϖ = 282.895°, eccentricity e = 0.016704. Contour labels (green) are in units of W m−2
Описание слайда:
Solar radiation bouncing atmosphere the theoretical daily-average insolation at the top of the atmosphere, where θ is the polar angle of the Earth's orbit, and θ = 0 at the vernal equinox, and θ = 90° at the summer solstice; φ is the latitude of the Earth. The calculation assumed conditions appropriate for 2000 A.D.: a solar constant of S0 = 1367 W m−2, obliquity of ε = 23.4398°, longitude of perihelion of ϖ = 282.895°, eccentricity e = 0.016704. Contour labels (green) are in units of W m−2

Слайд 45


Energy and power, solar astronomy. (Lecture 4), слайд №45
Описание слайда:

Слайд 46


Airmass
In astronomy, airmass is the optical path length through Earth's atmosphere for light from a celestial source. 
As it passes through the atmosphere, light is attenuated by scattering and absorption; the more atmosphere through which it passes, the greater the attenuation. 
Consequently, celestial bodies at the horizon appear less bright than when at the zenith.
Описание слайда:
Airmass In astronomy, airmass is the optical path length through Earth's atmosphere for light from a celestial source. As it passes through the atmosphere, light is attenuated by scattering and absorption; the more atmosphere through which it passes, the greater the attenuation. Consequently, celestial bodies at the horizon appear less bright than when at the zenith.

Слайд 47


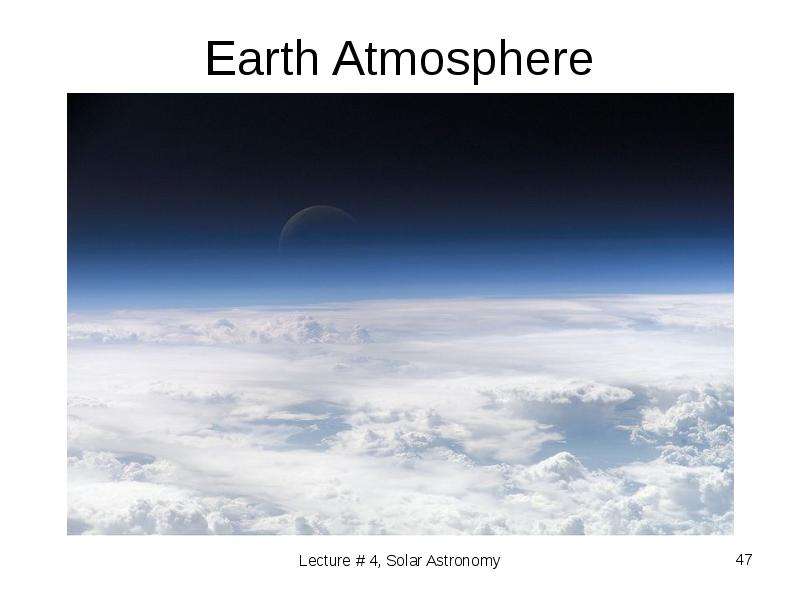
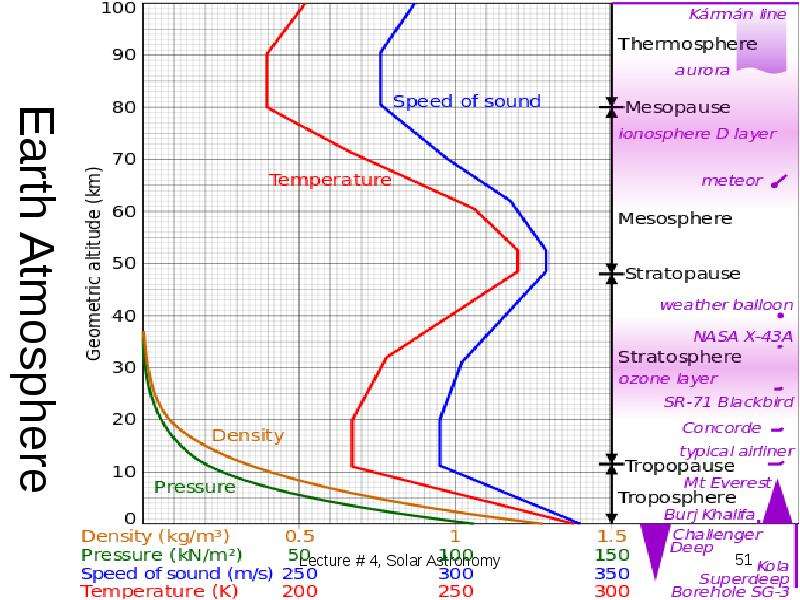
Earth Atmosphere
Описание слайда:
Earth Atmosphere

Слайд 48


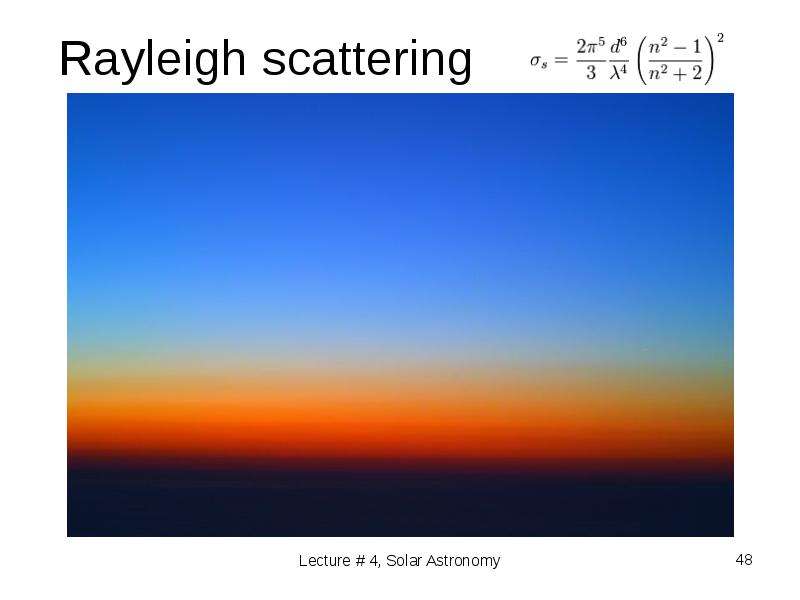
Rayleigh scattering
Описание слайда:
Rayleigh scattering

Слайд 49


Airmass
“Airmass” normally indicates relative airmass, the path length relative to that at the zenith at sea level, so by definition, the sea-level airmass when the sun is at the zenith is 1. 
Airmass increases as the angle between the source and the zenith increases, reaching a value of approximately 38 at the horizon. 
Airmass can be less than one at an elevation greater than sea level.
Описание слайда:
Airmass “Airmass” normally indicates relative airmass, the path length relative to that at the zenith at sea level, so by definition, the sea-level airmass when the sun is at the zenith is 1. Airmass increases as the angle between the source and the zenith increases, reaching a value of approximately 38 at the horizon. Airmass can be less than one at an elevation greater than sea level.

Слайд 50


Airmass
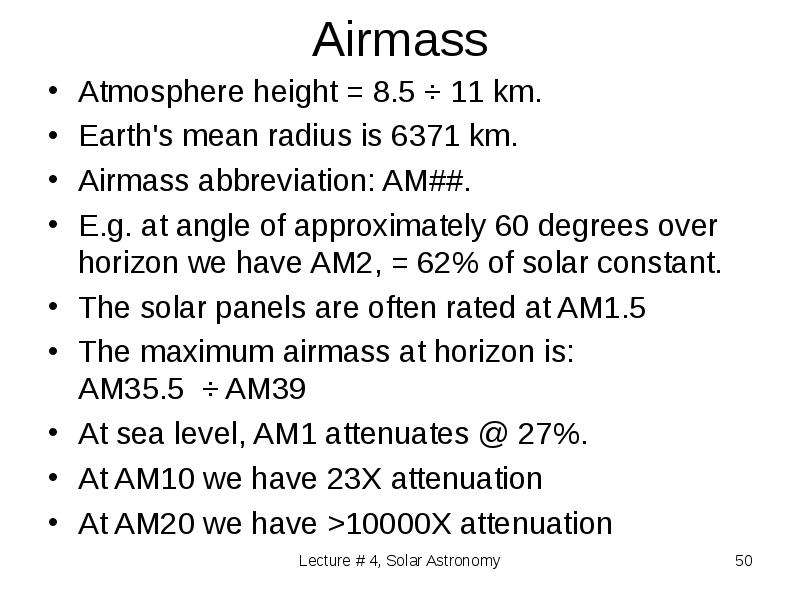
Atmosphere height = 8.5 ÷ 11 km.
Earth's mean radius is 6371 km.
Airmass abbreviation: AM##.
E.g. at angle of approximately 60 degrees over horizon we have AM2, = 62% of solar constant.
The solar panels are often rated at AM1.5
The maximum airmass at horizon is:
AM35.5  ÷ AM39
At sea level, AM1 attenuates @ 27%.
At AM10 we have 23X attenuation
At AM20 we have >10000X attenuation
Описание слайда:
Airmass Atmosphere height = 8.5 ÷ 11 km. Earth's mean radius is 6371 km. Airmass abbreviation: AM##. E.g. at angle of approximately 60 degrees over horizon we have AM2, = 62% of solar constant. The solar panels are often rated at AM1.5 The maximum airmass at horizon is: AM35.5 ÷ AM39 At sea level, AM1 attenuates @ 27%. At AM10 we have 23X attenuation At AM20 we have >10000X attenuation

Слайд 51


Earth Atmosphere
Описание слайда:
Earth Atmosphere

Слайд 52


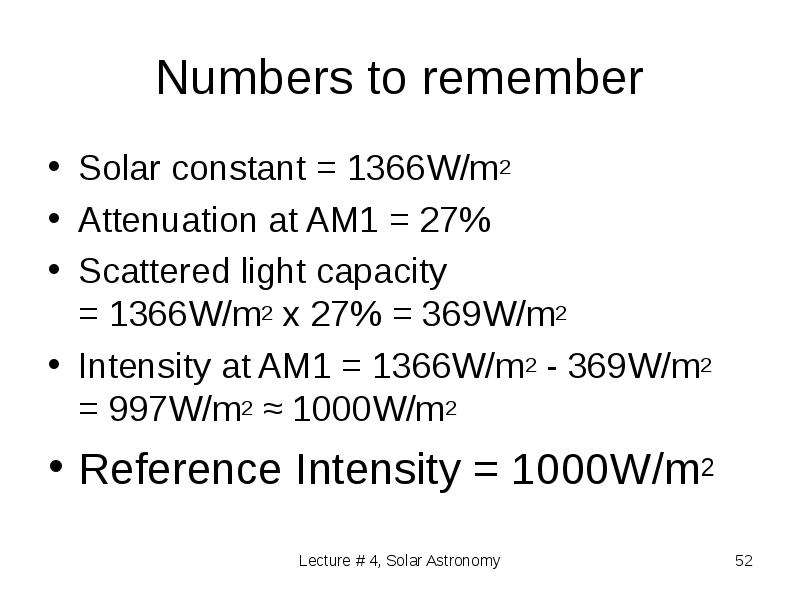
Numbers to remember
Solar constant = 1366W/m2 
Attenuation at AM1 = 27%
Scattered light capacity 
= 1366W/m2 x 27% = 369W/m2    
Intensity at AM1 = 1366W/m2 - 369W/m2 
= 997W/m2 ≈ 1000W/m2  
Reference Intensity = 1000W/m2
Описание слайда:
Numbers to remember Solar constant = 1366W/m2 Attenuation at AM1 = 27% Scattered light capacity = 1366W/m2 x 27% = 369W/m2 Intensity at AM1 = 1366W/m2 - 369W/m2 = 997W/m2 ≈ 1000W/m2 Reference Intensity = 1000W/m2

Слайд 53


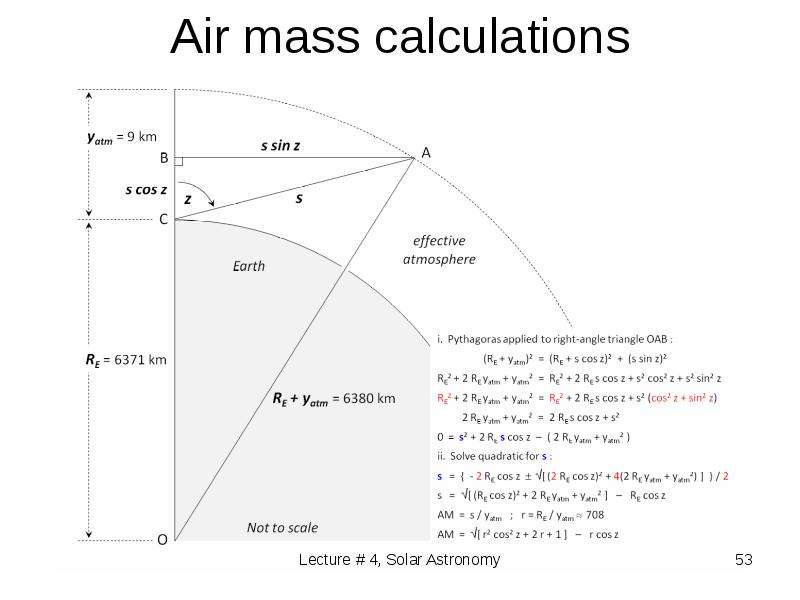
Air mass calculations
Описание слайда:
Air mass calculations

Слайд 54


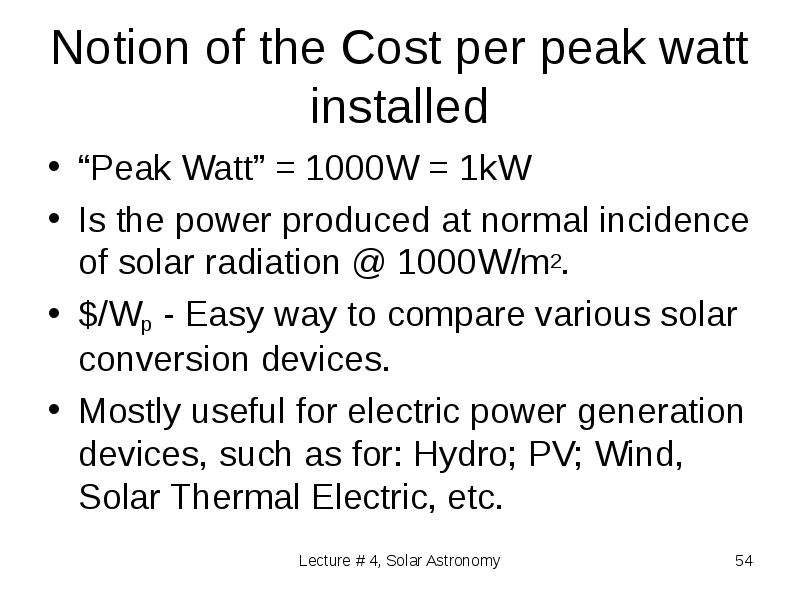
Notion of the Cost per peak watt installed
“Peak Watt” = 1000W = 1kW
Is the power produced at normal incidence of solar radiation @ 1000W/m2.
$/Wp - Easy way to compare various solar conversion devices.
Mostly useful for electric power generation devices, such as for: Hydro; PV; Wind, Solar Thermal Electric, etc.
Описание слайда:
Notion of the Cost per peak watt installed “Peak Watt” = 1000W = 1kW Is the power produced at normal incidence of solar radiation @ 1000W/m2. $/Wp - Easy way to compare various solar conversion devices. Mostly useful for electric power generation devices, such as for: Hydro; PV; Wind, Solar Thermal Electric, etc.


Похожие презентации
Mypresentation.ru
Загрузить презентацию