🗊 Презентация Scheduling. Introduction

Нажмите для полного просмотра!
Scheduling. Introduction, слайд №1 Scheduling. Introduction, слайд №2 Scheduling. Introduction, слайд №3 Scheduling. Introduction, слайд №4 Scheduling. Introduction, слайд №5 Scheduling. Introduction, слайд №6 Scheduling. Introduction, слайд №7 Scheduling. Introduction, слайд №8 Scheduling. Introduction, слайд №9 Scheduling. Introduction, слайд №10 Scheduling. Introduction, слайд №11 Scheduling. Introduction, слайд №12 Scheduling. Introduction, слайд №13 Scheduling. Introduction, слайд №14 Scheduling. Introduction, слайд №15 Scheduling. Introduction, слайд №16 Scheduling. Introduction, слайд №17 Scheduling. Introduction, слайд №18 Scheduling. Introduction, слайд №19 Scheduling. Introduction, слайд №20 Scheduling. Introduction, слайд №21 Scheduling. Introduction, слайд №22 Scheduling. Introduction, слайд №23 Scheduling. Introduction, слайд №24 Scheduling. Introduction, слайд №25 Scheduling. Introduction, слайд №26 Scheduling. Introduction, слайд №27 Scheduling. Introduction, слайд №28 Scheduling. Introduction, слайд №29 Scheduling. Introduction, слайд №30 Scheduling. Introduction, слайд №31 Scheduling. Introduction, слайд №32 Scheduling. Introduction, слайд №33 Scheduling. Introduction, слайд №34 Scheduling. Introduction, слайд №35 Scheduling. Introduction, слайд №36 Scheduling. Introduction, слайд №37 Scheduling. Introduction, слайд №38 Scheduling. Introduction, слайд №39 Scheduling. Introduction, слайд №40 Scheduling. Introduction, слайд №41 Scheduling. Introduction, слайд №42 Scheduling. Introduction, слайд №43 Scheduling. Introduction, слайд №44 Scheduling. Introduction, слайд №45 Scheduling. Introduction, слайд №46 Scheduling. Introduction, слайд №47 Scheduling. Introduction, слайд №48 Scheduling. Introduction, слайд №49

Содержание
Вы можете ознакомиться и скачать презентацию на тему Scheduling. Introduction. Доклад-сообщение содержит 49 слайдов. Презентации для любого класса можно скачать бесплатно. Если материал и наш сайт презентаций Mypresentation Вам понравились – поделитесь им с друзьями с помощью социальных кнопок и добавьте в закладки в своем браузере.
Слайды и текст этой презентации


Слайд 1


Scheduling
Описание слайда:
Scheduling

Слайд 2


Where are we? 1. Introduction 2. Project Life Cycles 3. Project Artifacts 4. Work Elements, Schedule, Budget 4.1 Work Breakdown Structure 4.2...
Описание слайда:
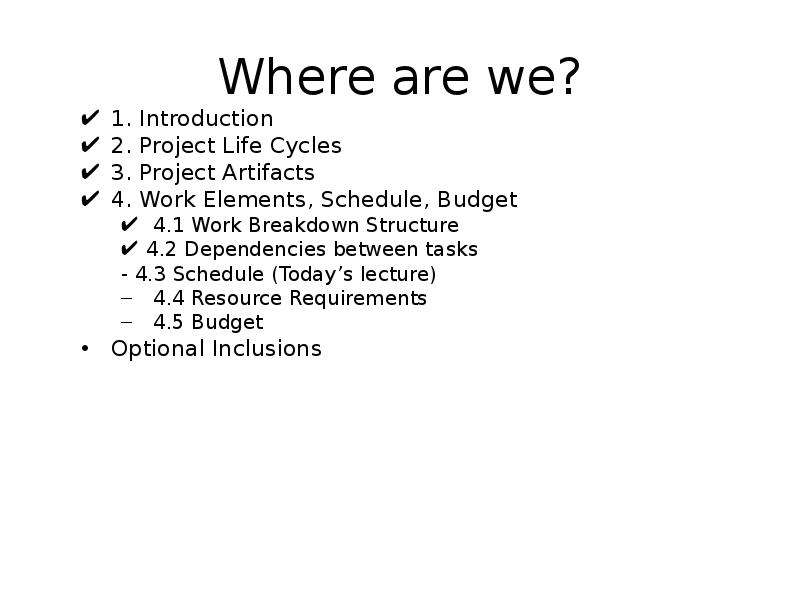
Where are we? 1. Introduction 2. Project Life Cycles 3. Project Artifacts 4. Work Elements, Schedule, Budget 4.1 Work Breakdown Structure 4.2 Dependencies between tasks - 4.3 Schedule (Today’s lecture) 4.4 Resource Requirements 4.5 Budget Optional Inclusions

Слайд 3


Outline The last lecture dealt with Artifacts of Project Today we focus on Dependencies and Scheduling Estimating times for activities Determining...
Описание слайда:
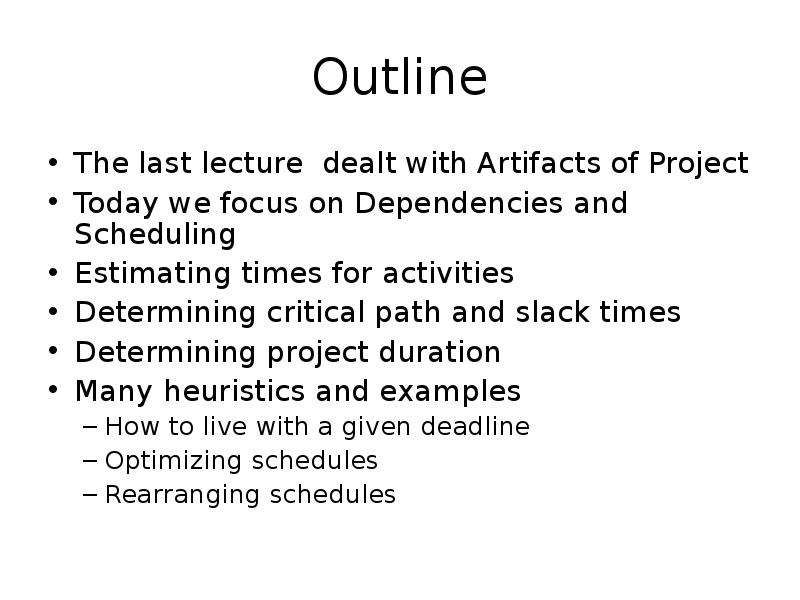
Outline The last lecture dealt with Artifacts of Project Today we focus on Dependencies and Scheduling Estimating times for activities Determining critical path and slack times Determining project duration Many heuristics and examples How to live with a given deadline Optimizing schedules Rearranging schedules

Слайд 4


Dependency Diagrams (Overview) Dependency diagrams consist of 3 elements Event (also called milestone): A significant occurrence in the life of a...
Описание слайда:
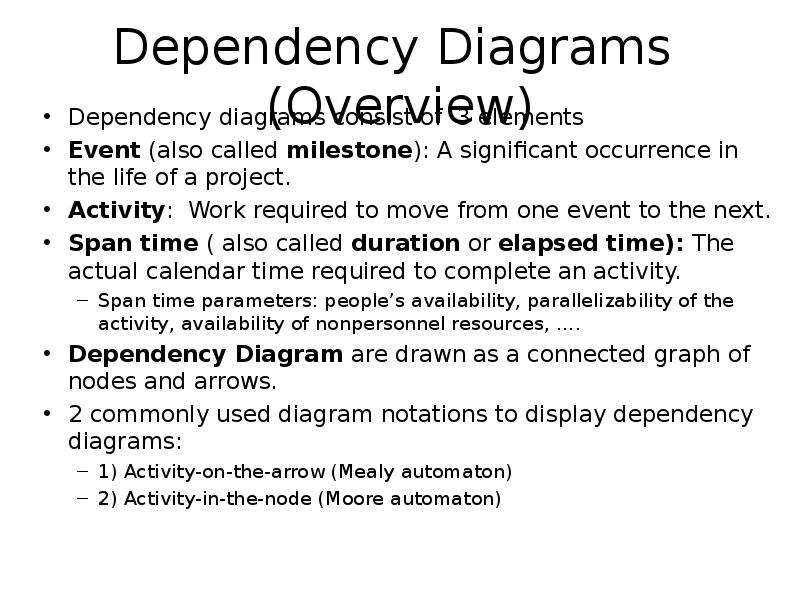
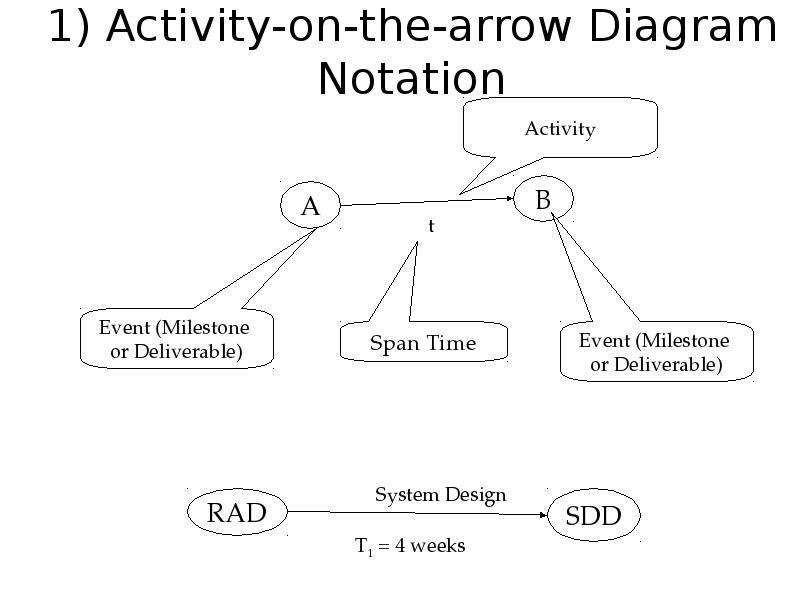
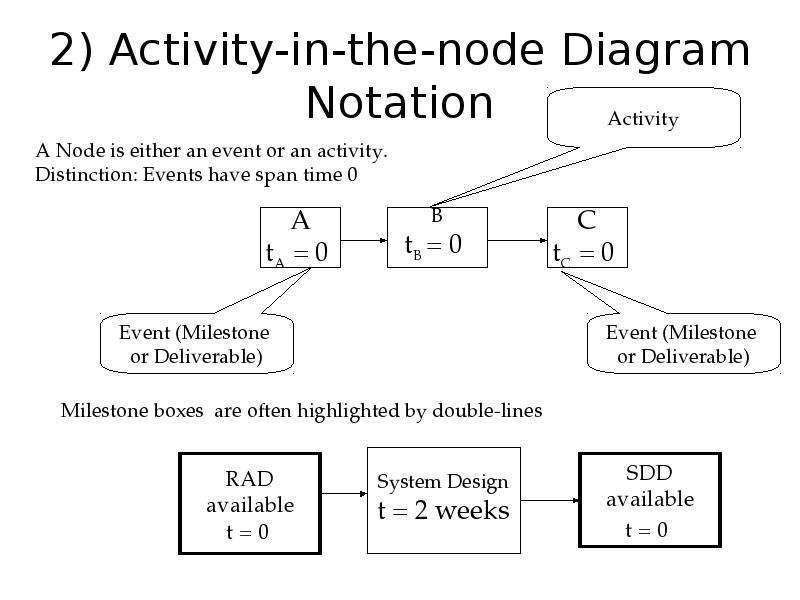
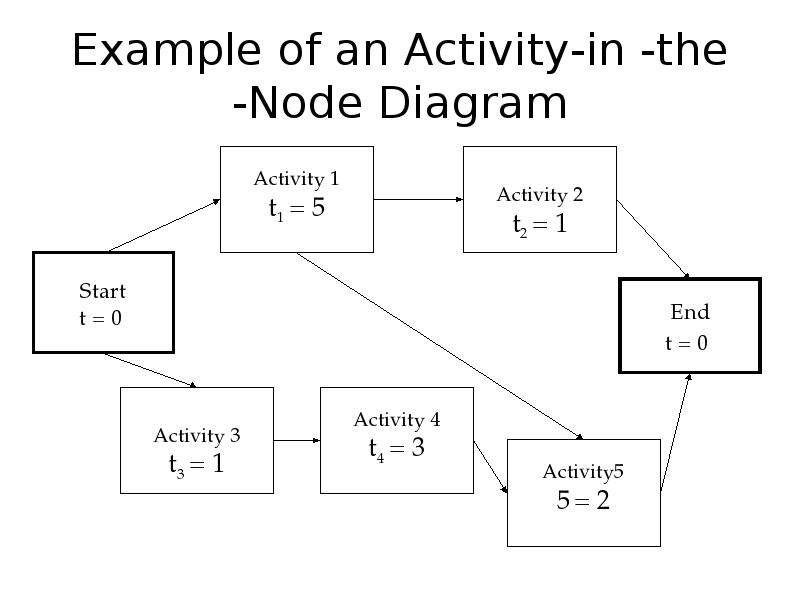
Dependency Diagrams (Overview) Dependency diagrams consist of 3 elements Event (also called milestone): A significant occurrence in the life of a project. Activity: Work required to move from one event to the next. Span time ( also called duration or elapsed time): The actual calendar time required to complete an activity. Span time parameters: people’s availability, parallelizability of the activity, availability of nonpersonnel resources, …. Dependency Diagram are drawn as a connected graph of nodes and arrows. 2 commonly used diagram notations to display dependency diagrams: 1) Activity-on-the-arrow (Mealy automaton) 2) Activity-in-the-node (Moore automaton)

Слайд 5


Why Dependency Diagrams? Example: You are assigned a project consisting of 10 activities which take one week each to be completed. How long does the...
Описание слайда:
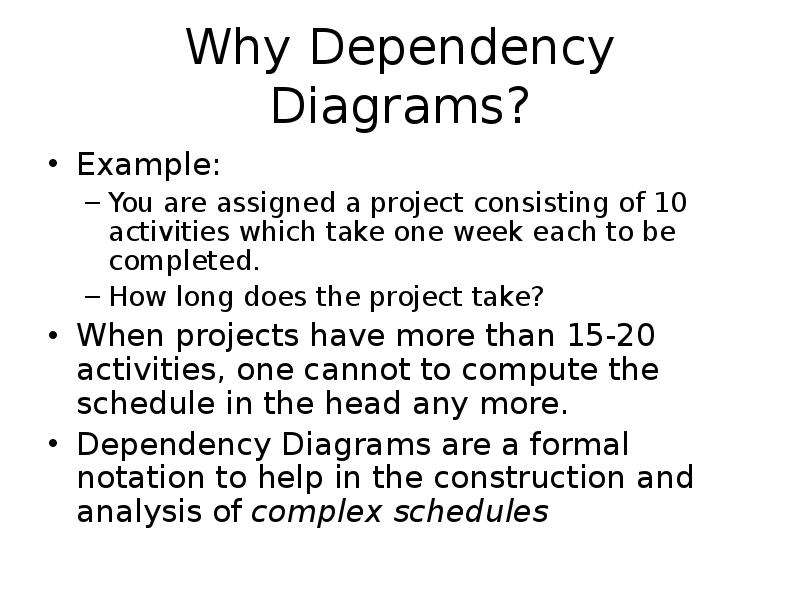
Why Dependency Diagrams? Example: You are assigned a project consisting of 10 activities which take one week each to be completed. How long does the project take? When projects have more than 15-20 activities, one cannot to compute the schedule in the head any more. Dependency Diagrams are a formal notation to help in the construction and analysis of complex schedules

Слайд 6


1) Activity-on-the-arrow Diagram Notation
Описание слайда:
1) Activity-on-the-arrow Diagram Notation

Слайд 7


PERT PERT is an activity-on-the-arrow notation PERT = Program Evaluation and Review Technique Developed in the 50s to plan the Polaris weapon system...
Описание слайда:
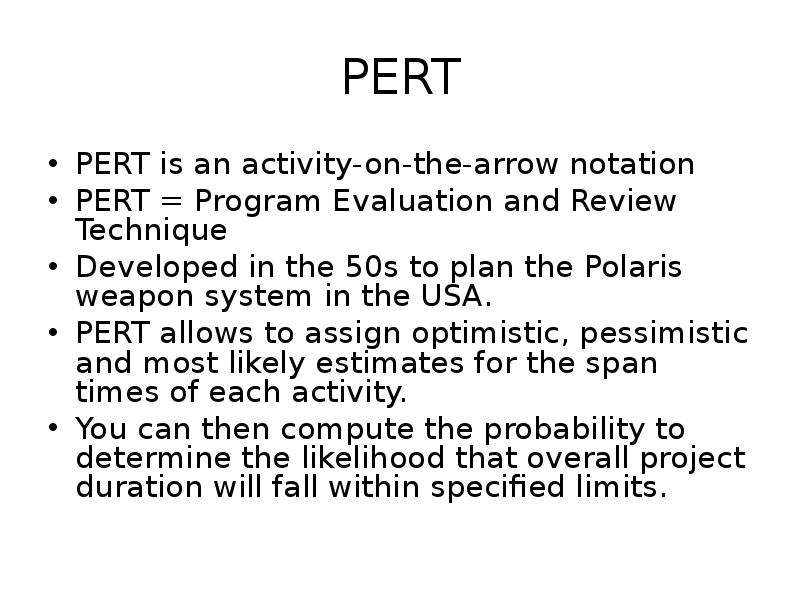
PERT PERT is an activity-on-the-arrow notation PERT = Program Evaluation and Review Technique Developed in the 50s to plan the Polaris weapon system in the USA. PERT allows to assign optimistic, pessimistic and most likely estimates for the span times of each activity. You can then compute the probability to determine the likelihood that overall project duration will fall within specified limits.

Слайд 8


2) Activity-in-the-node Diagram Notation
Описание слайда:
2) Activity-in-the-node Diagram Notation

Слайд 9


Example of an Activity-in -the -Node Diagram
Описание слайда:
Example of an Activity-in -the -Node Diagram

Слайд 10


What do we do with these diagrams? Compute the project duration Determine activities that are critical to ensure a timely delivery Analyse the...
Описание слайда:
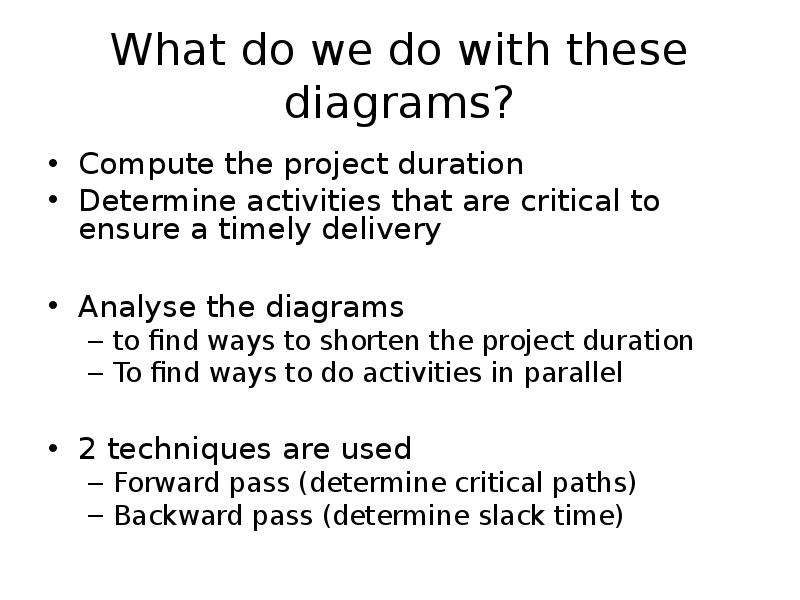
What do we do with these diagrams? Compute the project duration Determine activities that are critical to ensure a timely delivery Analyse the diagrams to find ways to shorten the project duration To find ways to do activities in parallel 2 techniques are used Forward pass (determine critical paths) Backward pass (determine slack time)

Слайд 11


Definitions: Critical Path and Slack Time4 Critical path: A sequence of activities that take the longest time to complete The length of the critical...
Описание слайда:
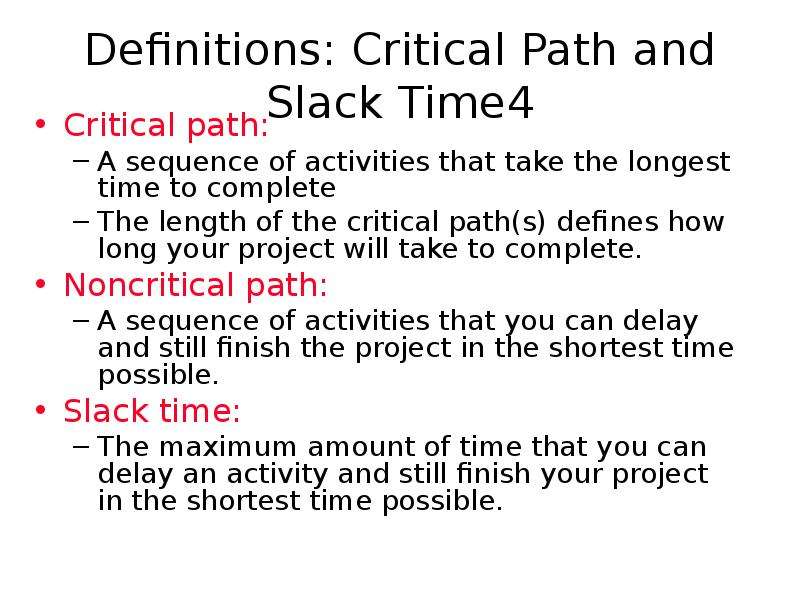
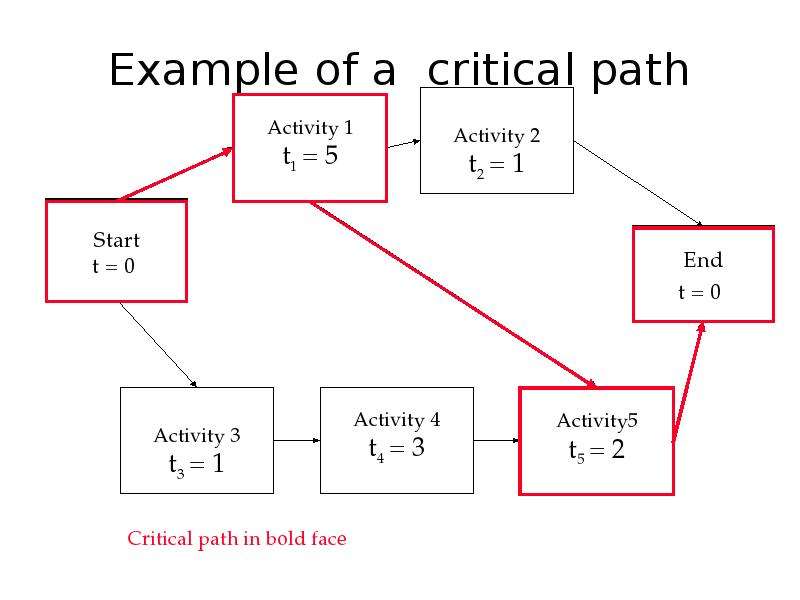
Definitions: Critical Path and Slack Time4 Critical path: A sequence of activities that take the longest time to complete The length of the critical path(s) defines how long your project will take to complete. Noncritical path: A sequence of activities that you can delay and still finish the project in the shortest time possible. Slack time: The maximum amount of time that you can delay an activity and still finish your project in the shortest time possible.

Слайд 12


Example of a critical path
Описание слайда:
Example of a critical path

Слайд 13


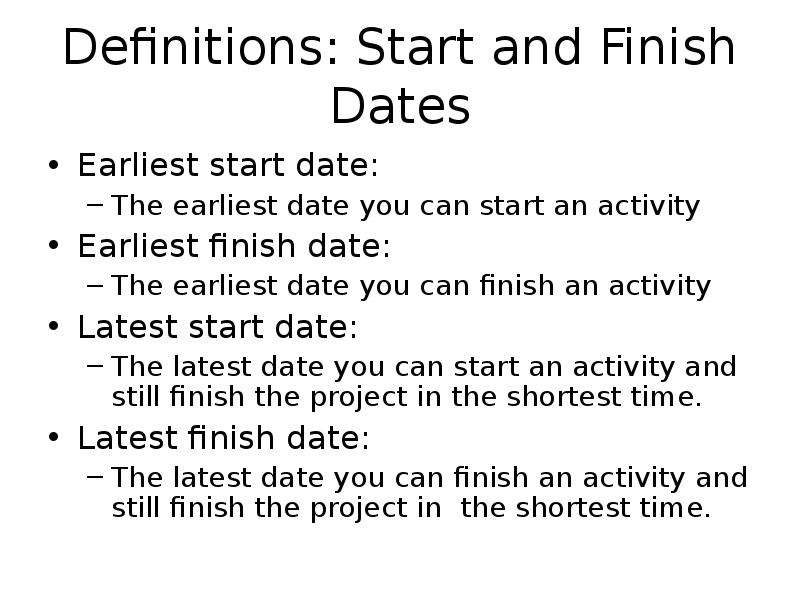
Definitions: Start and Finish Dates Earliest start date: The earliest date you can start an activity Earliest finish date: The earliest date you can...
Описание слайда:
Definitions: Start and Finish Dates Earliest start date: The earliest date you can start an activity Earliest finish date: The earliest date you can finish an activity Latest start date: The latest date you can start an activity and still finish the project in the shortest time. Latest finish date: The latest date you can finish an activity and still finish the project in the shortest time.

Слайд 14


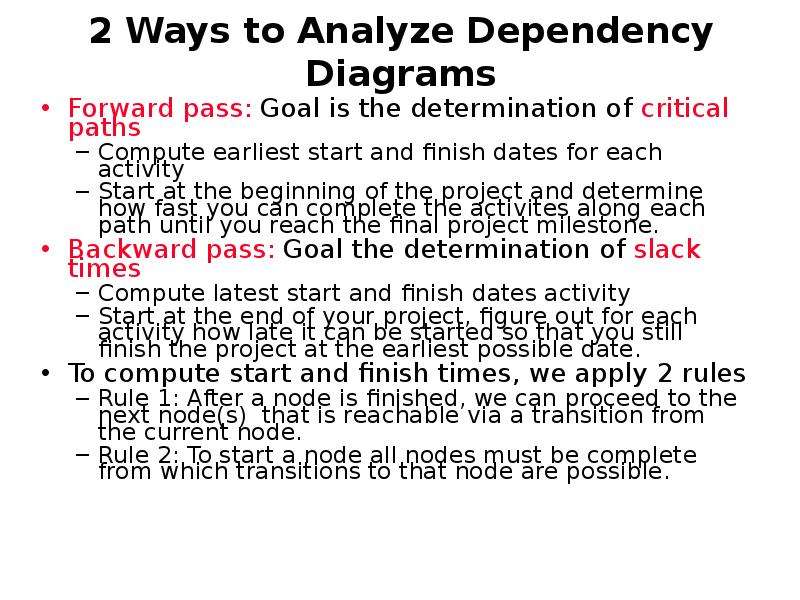
2 Ways to Analyze Dependency Diagrams Forward pass: Goal is the determination of critical paths Compute earliest start and finish dates for each...
Описание слайда:
2 Ways to Analyze Dependency Diagrams Forward pass: Goal is the determination of critical paths Compute earliest start and finish dates for each activity Start at the beginning of the project and determine how fast you can complete the activites along each path until you reach the final project milestone. Backward pass: Goal the determination of slack times Compute latest start and finish dates activity Start at the end of your project, figure out for each activity how late it can be started so that you still finish the project at the earliest possible date. To compute start and finish times, we apply 2 rules Rule 1: After a node is finished, we can proceed to the next node(s) that is reachable via a transition from the current node. Rule 2: To start a node all nodes must be complete from which transitions to that node are possible.

Слайд 15


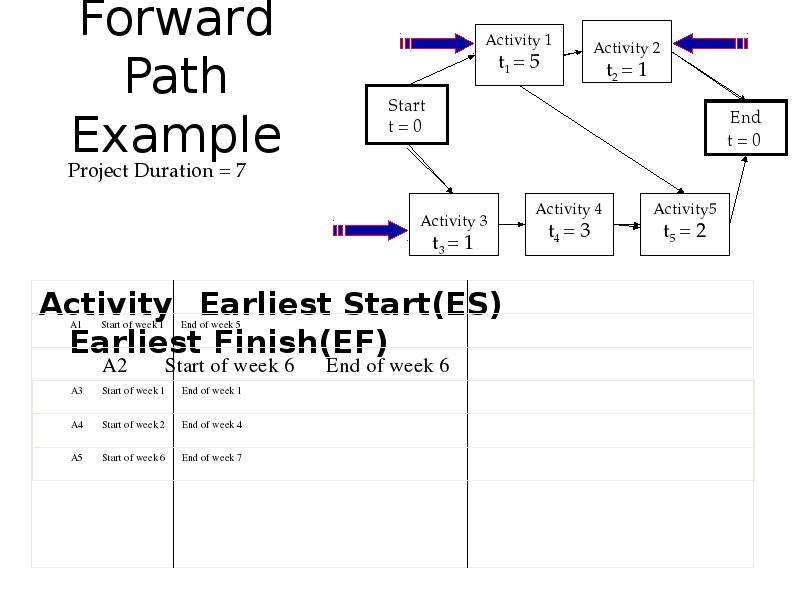
Forward Path Example Activity Earliest Start(ES) Earliest Finish(EF)
Описание слайда:
Forward Path Example Activity Earliest Start(ES) Earliest Finish(EF)

Слайд 16


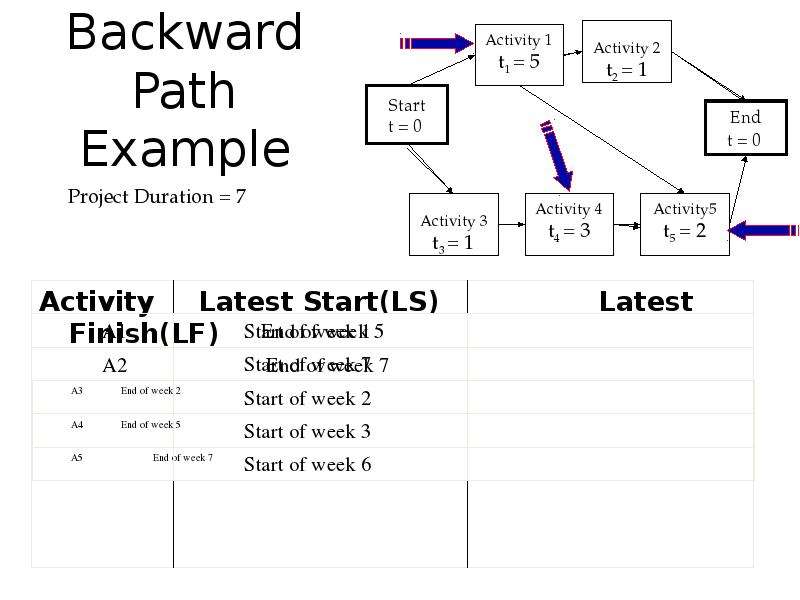
Backward Path Example Activity Latest Start(LS) Latest Finish(LF)
Описание слайда:
Backward Path Example Activity Latest Start(LS) Latest Finish(LF)

Слайд 17


Computation of slack times Slack time ST of an activity A: STA = LSA - ESA Subtract the earliest start date from the latest start date for each...
Описание слайда:
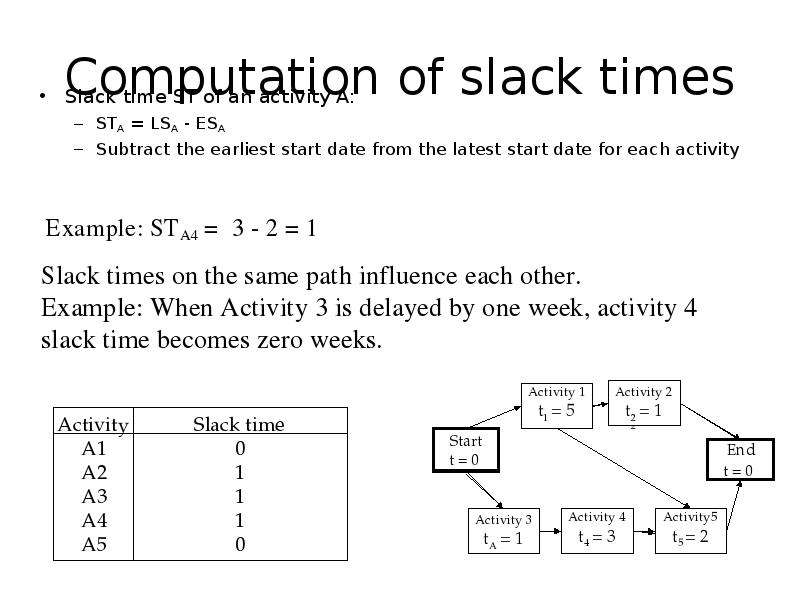
Computation of slack times Slack time ST of an activity A: STA = LSA - ESA Subtract the earliest start date from the latest start date for each activity

Слайд 18


Path types in dependency graphs Critical path: Any path in a dependency diagram, in which all activities have zero slack time. Noncritical path: Any...
Описание слайда:
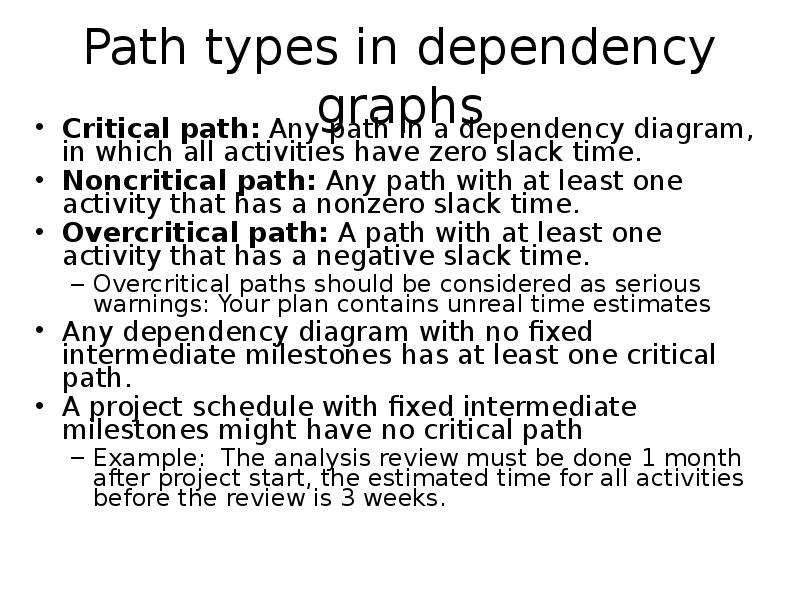
Path types in dependency graphs Critical path: Any path in a dependency diagram, in which all activities have zero slack time. Noncritical path: Any path with at least one activity that has a nonzero slack time. Overcritical path: A path with at least one activity that has a negative slack time. Overcritical paths should be considered as serious warnings: Your plan contains unreal time estimates Any dependency diagram with no fixed intermediate milestones has at least one critical path. A project schedule with fixed intermediate milestones might have no critical path Example: The analysis review must be done 1 month after project start, the estimated time for all activities before the review is 3 weeks.

Слайд 19


Frequently used formats for dependency graphs Milestone View (“Key-Events report”): A table that lists milestones and the dates on which you plan to...
Описание слайда:
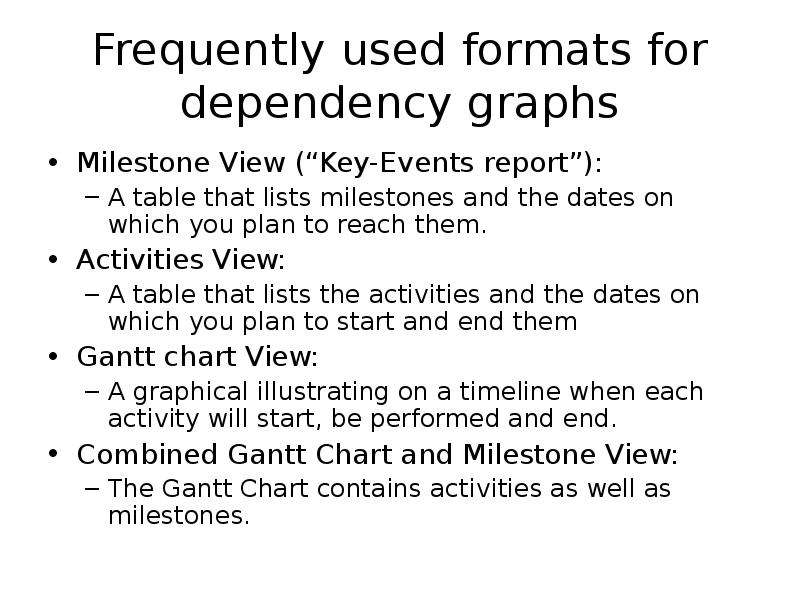
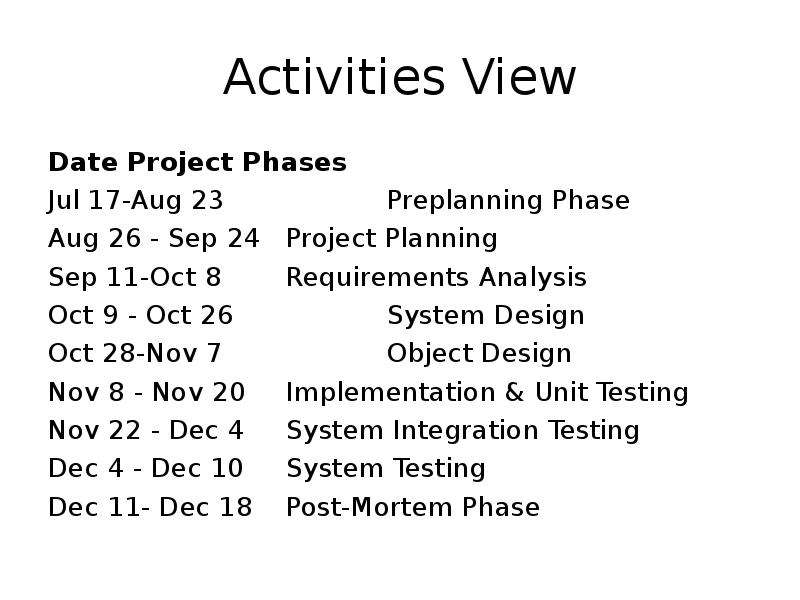
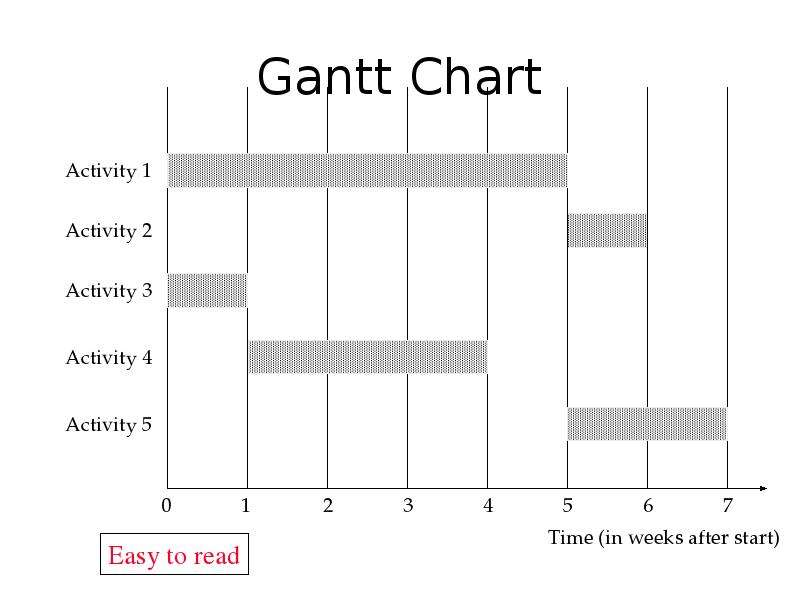
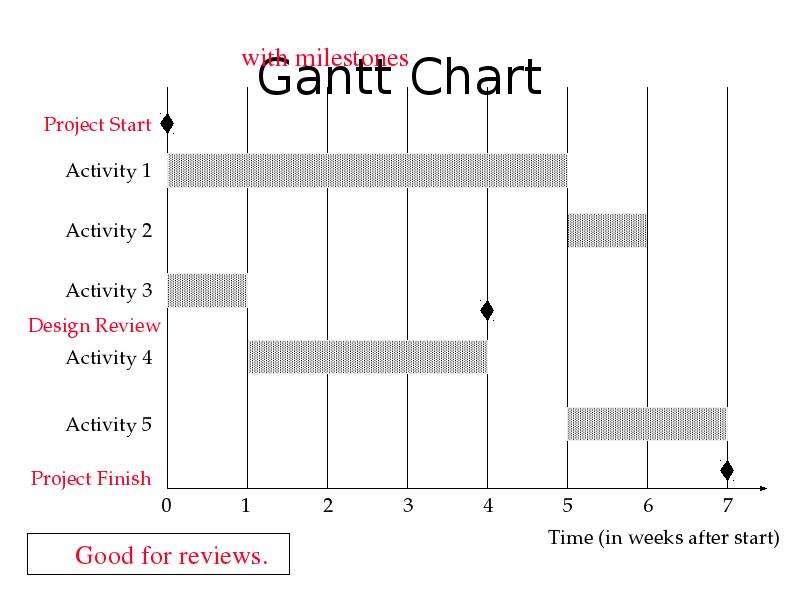
Frequently used formats for dependency graphs Milestone View (“Key-Events report”): A table that lists milestones and the dates on which you plan to reach them. Activities View: A table that lists the activities and the dates on which you plan to start and end them Gantt chart View: A graphical illustrating on a timeline when each activity will start, be performed and end. Combined Gantt Chart and Milestone View: The Gantt Chart contains activities as well as milestones.

Слайд 20


Key-Events Report Date Milestone August 26 Project Kickoff (with Client) October 16 Analysis Review October 26 System Design Review November 7...
Описание слайда:
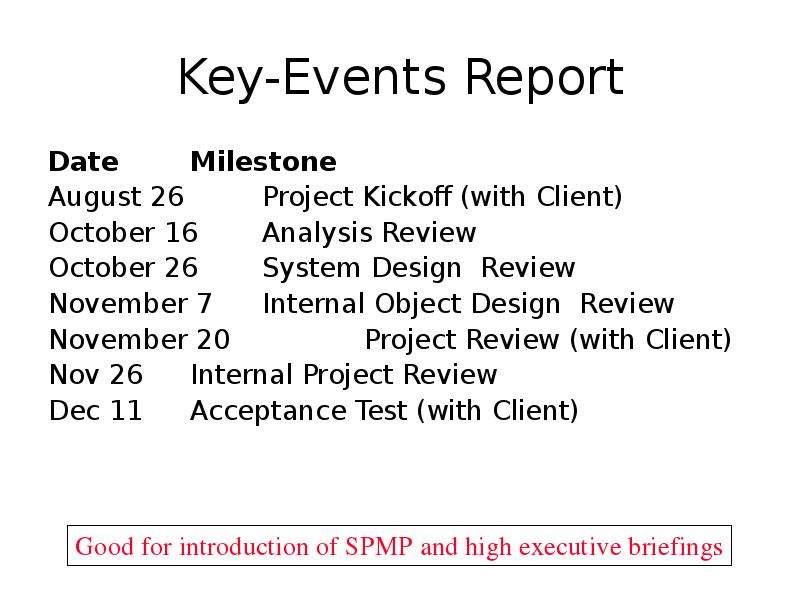
Key-Events Report Date Milestone August 26 Project Kickoff (with Client) October 16 Analysis Review October 26 System Design Review November 7 Internal Object Design Review November 20 Project Review (with Client) Nov 26 Internal Project Review Dec 11 Acceptance Test (with Client)

Слайд 21


Activities View Date Project Phases Jul 17-Aug 23 Preplanning Phase Aug 26 - Sep 24 Project Planning Sep 11-Oct 8 Requirements Analysis Oct 9 - Oct...
Описание слайда:
Activities View Date Project Phases Jul 17-Aug 23 Preplanning Phase Aug 26 - Sep 24 Project Planning Sep 11-Oct 8 Requirements Analysis Oct 9 - Oct 26 System Design Oct 28-Nov 7 Object Design Nov 8 - Nov 20 Implementation & Unit Testing Nov 22 - Dec 4 System Integration Testing Dec 4 - Dec 10 System Testing Dec 11- Dec 18 Post-Mortem Phase

Слайд 22


Gantt Chart
Описание слайда:
Gantt Chart

Слайд 23


Gantt Chart
Описание слайда:
Gantt Chart

Слайд 24


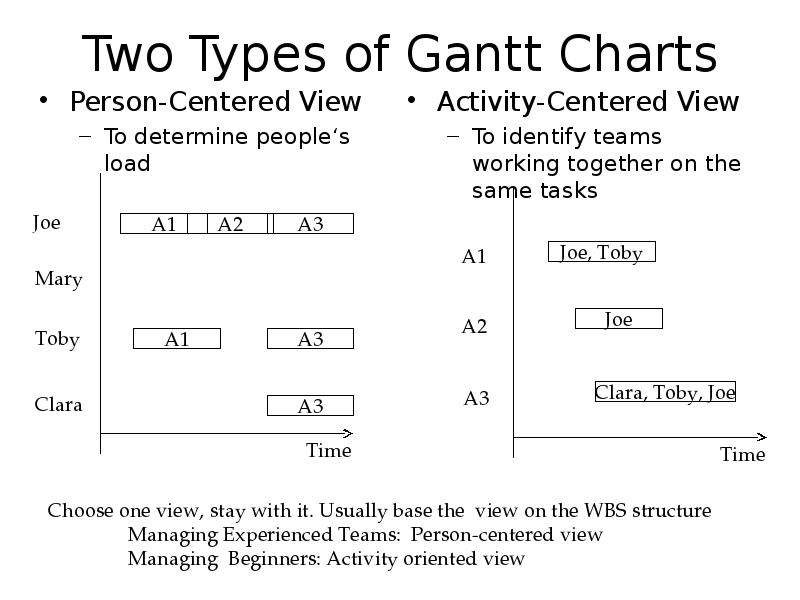
Two Types of Gantt Charts Person-Centered View To determine people‘s load
Описание слайда:
Two Types of Gantt Charts Person-Centered View To determine people‘s load

Слайд 25


Tools support for Establishing Schedules Tool support for Graphical user interface for entering activity data Automatic computation of critical paths...
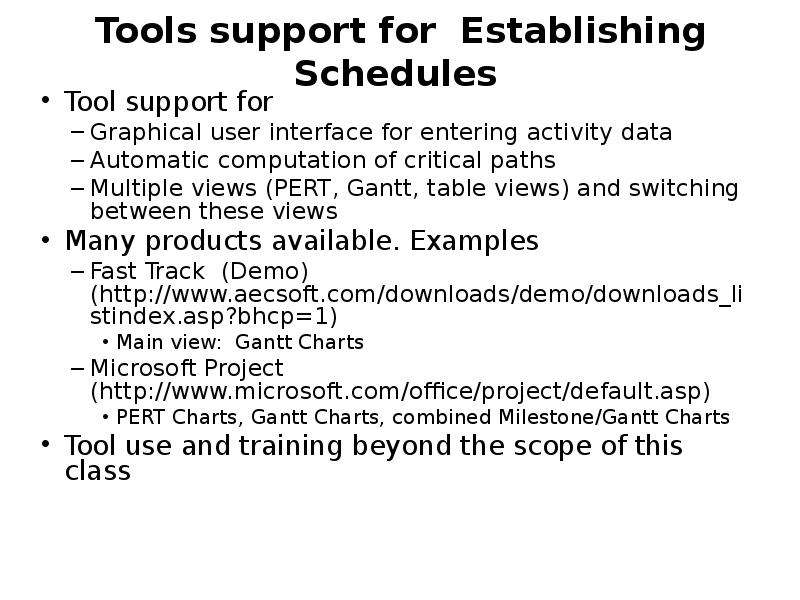
Описание слайда:
Tools support for Establishing Schedules Tool support for Graphical user interface for entering activity data Automatic computation of critical paths Multiple views (PERT, Gantt, table views) and switching between these views Many products available. Examples Fast Track (Demo) ( Main view: Gantt Charts Microsoft Project ( PERT Charts, Gantt Charts, combined Milestone/Gantt Charts Tool use and training beyond the scope of this class

Слайд 26


What do we cover now? How to develop an initial project schedule How to shorten the project duration Mistakes made during preparation of schedules...
Описание слайда:
What do we cover now? How to develop an initial project schedule How to shorten the project duration Mistakes made during preparation of schedules The danger of fudge factors How to identify when a project goes off-track (actual project does not match the project plan). How to become a good software project manager

Слайд 27


How to develop an Initial Project Schedule Identify all your activities (reuse a template if possible) Identify intermediate and final dates that...
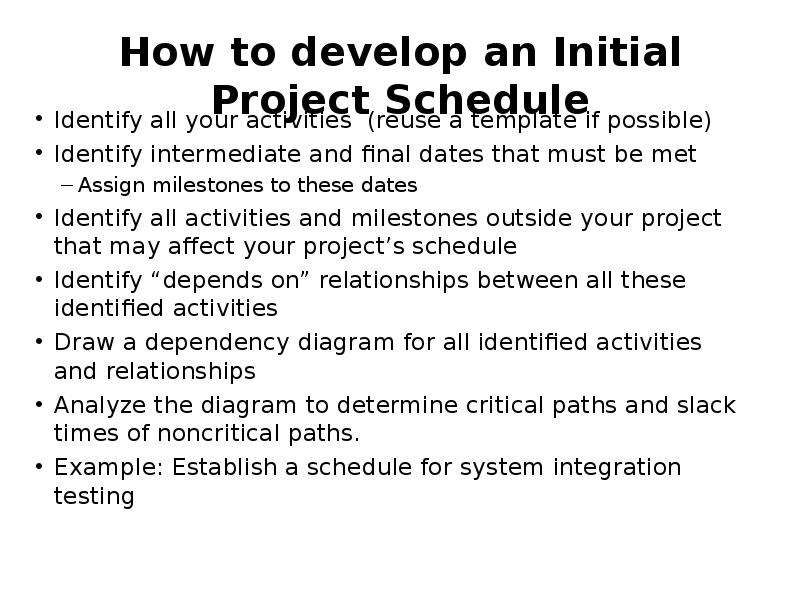
Описание слайда:
How to develop an Initial Project Schedule Identify all your activities (reuse a template if possible) Identify intermediate and final dates that must be met Assign milestones to these dates Identify all activities and milestones outside your project that may affect your project’s schedule Identify “depends on” relationships between all these identified activities Draw a dependency diagram for all identified activities and relationships Analyze the diagram to determine critical paths and slack times of noncritical paths. Example: Establish a schedule for system integration testing

Слайд 28


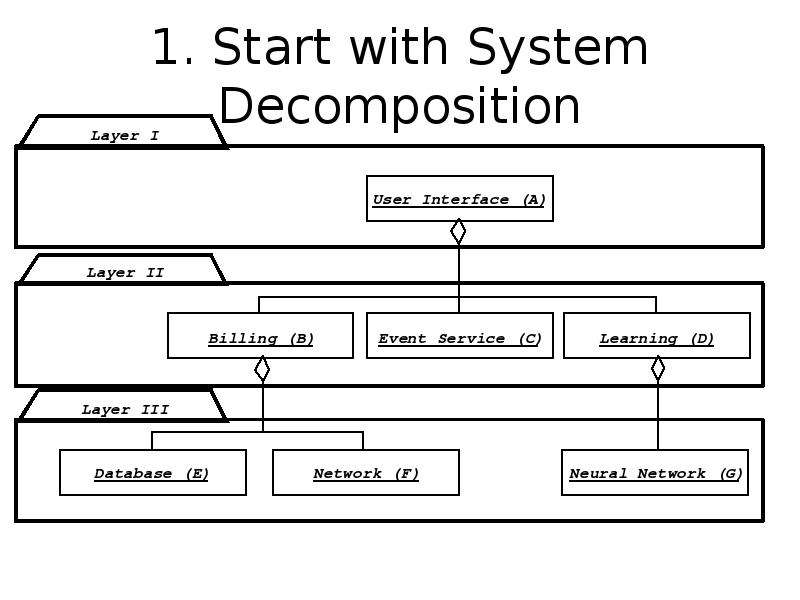
Developing a Schedule for Integration Testing Five Steps: 1. Start with System Decomposition 2. Determine your Integration Testing Strategy 3....
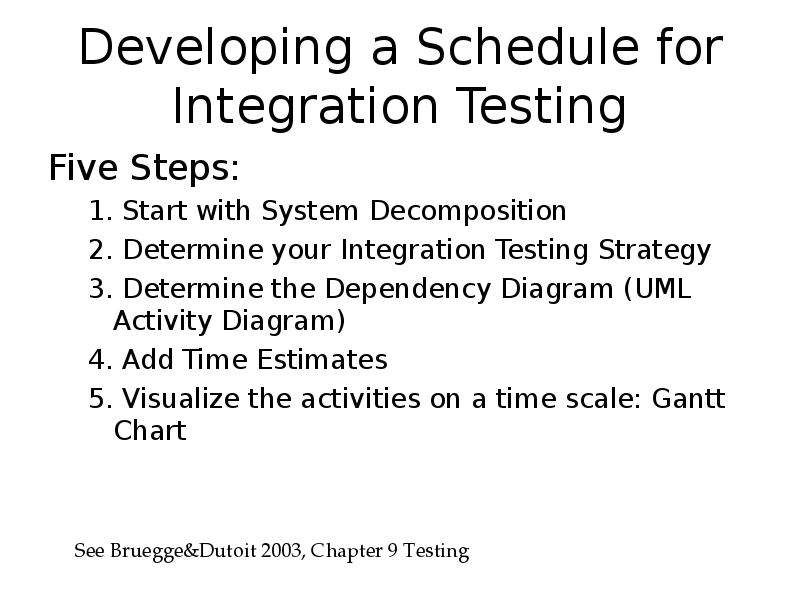
Описание слайда:
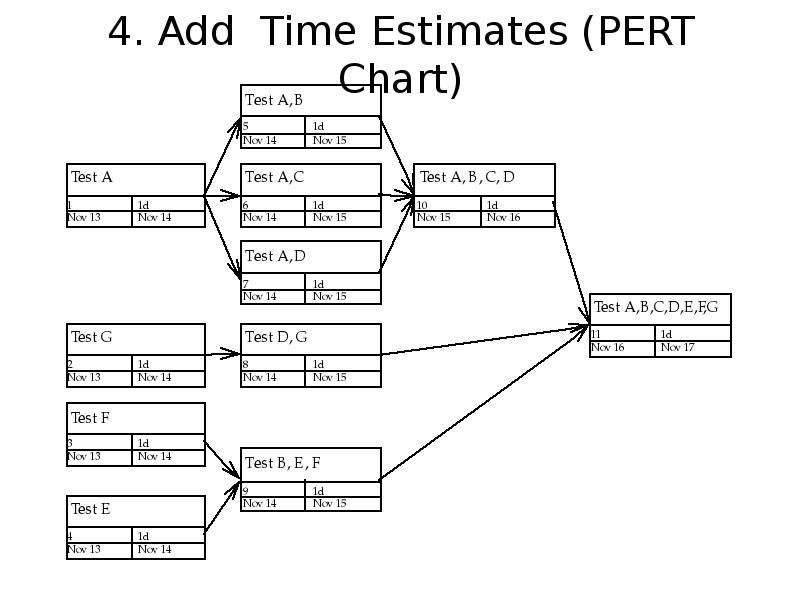
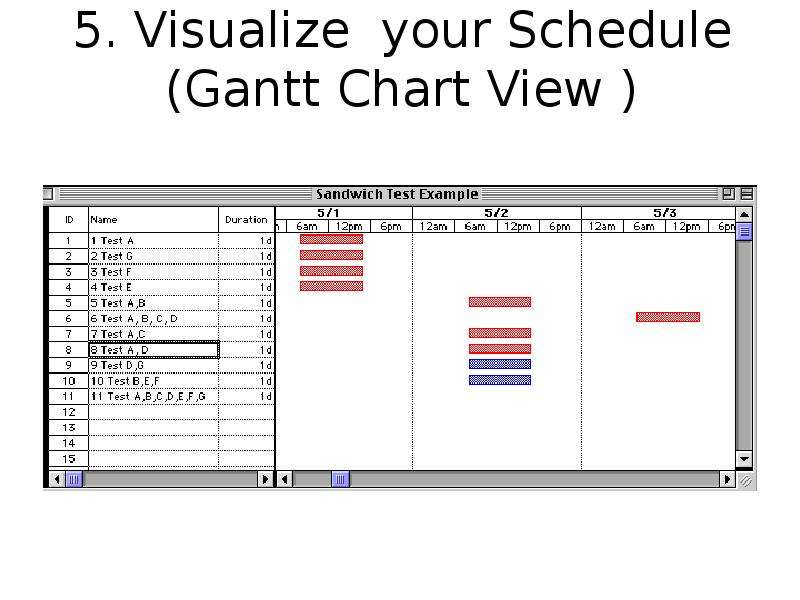
Developing a Schedule for Integration Testing Five Steps: 1. Start with System Decomposition 2. Determine your Integration Testing Strategy 3. Determine the Dependency Diagram (UML Activity Diagram) 4. Add Time Estimates 5. Visualize the activities on a time scale: Gantt Chart

Слайд 29


1. Start with System Decomposition
Описание слайда:
1. Start with System Decomposition

Слайд 30


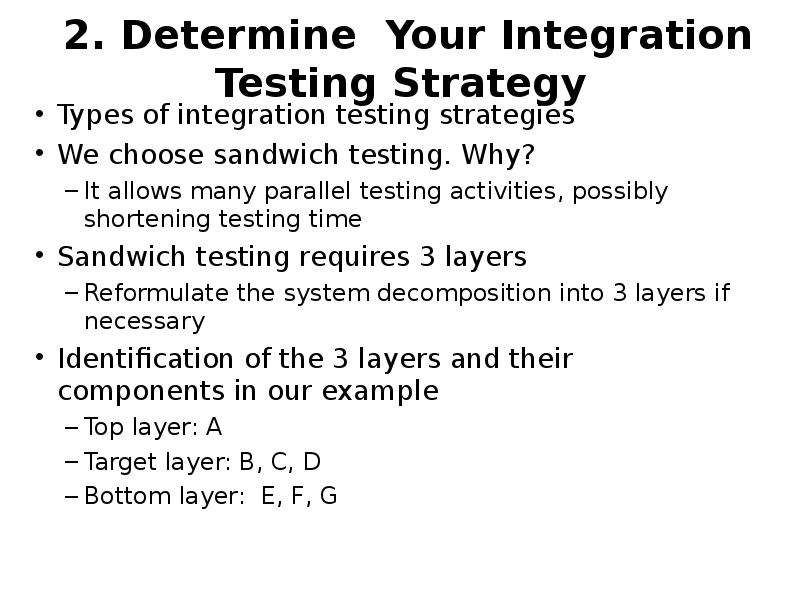
2. Determine Your Integration Testing Strategy Types of integration testing strategies We choose sandwich testing. Why? It allows many parallel...
Описание слайда:
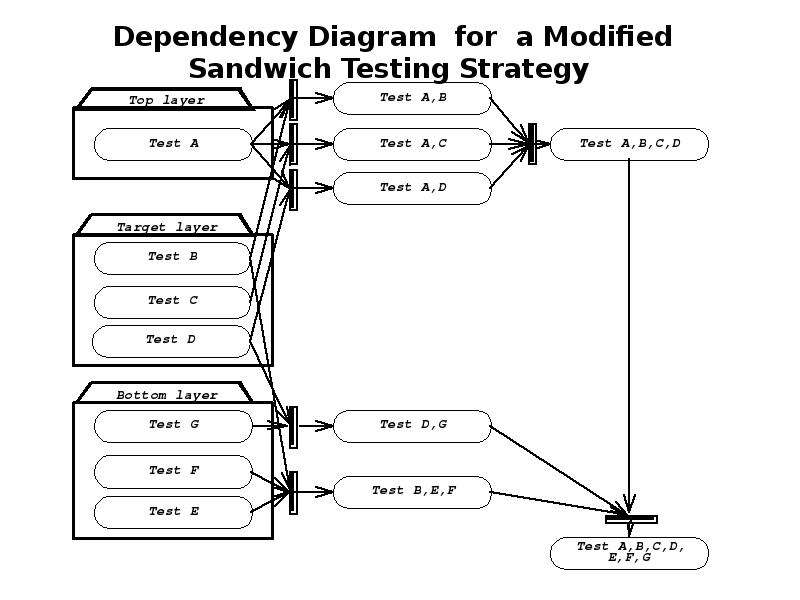
2. Determine Your Integration Testing Strategy Types of integration testing strategies We choose sandwich testing. Why? It allows many parallel testing activities, possibly shortening testing time Sandwich testing requires 3 layers Reformulate the system decomposition into 3 layers if necessary Identification of the 3 layers and their components in our example Top layer: A Target layer: B, C, D Bottom layer: E, F, G

Слайд 31


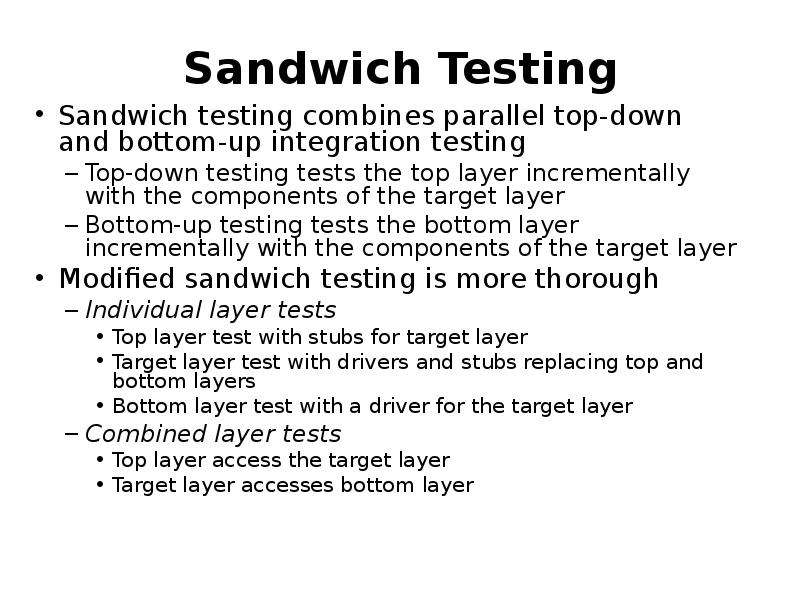
Sandwich Testing Sandwich testing combines parallel top-down and bottom-up integration testing Top-down testing tests the top layer incrementally...
Описание слайда:
Sandwich Testing Sandwich testing combines parallel top-down and bottom-up integration testing Top-down testing tests the top layer incrementally with the components of the target layer Bottom-up testing tests the bottom layer incrementally with the components of the target layer Modified sandwich testing is more thorough Individual layer tests Top layer test with stubs for target layer Target layer test with drivers and stubs replacing top and bottom layers Bottom layer test with a driver for the target layer Combined layer tests Top layer access the target layer Target layer accesses bottom layer

Слайд 32


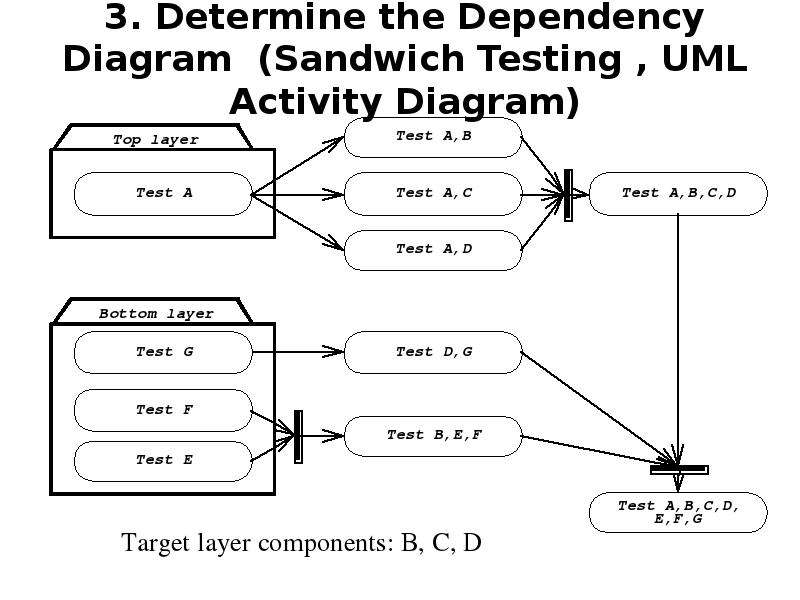
3. Determine the Dependency Diagram (Sandwich Testing , UML Activity Diagram)
Описание слайда:
3. Determine the Dependency Diagram (Sandwich Testing , UML Activity Diagram)

Слайд 33


Dependency Diagram for a Modified Sandwich Testing Strategy
Описание слайда:
Dependency Diagram for a Modified Sandwich Testing Strategy

Слайд 34


4. Add Time Estimates (PERT Chart)
Описание слайда:
4. Add Time Estimates (PERT Chart)

Слайд 35


5. Visualize your Schedule (Gantt Chart View )
Описание слайда:
5. Visualize your Schedule (Gantt Chart View )

Слайд 36


What do we cover now? How to develop an initial project schedule How to shorten the project duration Mistakes made during preparation of schedules...
Описание слайда:
What do we cover now? How to develop an initial project schedule How to shorten the project duration Mistakes made during preparation of schedules The danger of fudge factors How to identify when a project goes off-track (actual project does not match the project plan). How to become a better software project manager

Слайд 37


How to reduce the planned project time Recheck the original span time estimates Ask other experts to check the estimates Has the development...
Описание слайда:
How to reduce the planned project time Recheck the original span time estimates Ask other experts to check the estimates Has the development environment changed? (batch vs interactive systems, desktop vs laptop development) Hire more experienced personnel to perform the activities Trade-off: Experts work fast, but cost more Consider different strategies to perform the activities Consider to Buy a work product instead of building it (Trade-off: Buy-vs-build) Consider extern subcontractor instead of performing the work work internally Try to find parallelizable activites on the critical path Continue coding while waiting for the results of a review Risky activity, portions of the work may have to be redone. Develop an entirely new strategy to solve the problem

Слайд 38


Typical Mistakes when Developing Schedules The „Backing in“ Mistake Using Fudge Factors
Описание слайда:
Typical Mistakes when Developing Schedules The „Backing in“ Mistake Using Fudge Factors

Слайд 39


The “Backing in” Mistake Definition “Backing In”: You start at the last milestone of the project and work your way back toward the starting...
Описание слайда:
The “Backing in” Mistake Definition “Backing In”: You start at the last milestone of the project and work your way back toward the starting milestone, while estimating durations that will add up to the amount of the available time Problems with Backing in: You probably miss activities because your focus is on meeting the time constraints rather than identifying the required work Your span time estimates are based on what you allow activites to take, not what they actually require The order in which you propose activities may not be the most effective one. Instead, start with computing all the required times and then try to shorten the project duration

Слайд 40


Using Fudge Factors Parkinson formulated this law for project completion: Work tends to expand to fill the time allotted for it. Fudge factor: A...
Описание слайда:
Using Fudge Factors Parkinson formulated this law for project completion: Work tends to expand to fill the time allotted for it. Fudge factor: A fudge factor is the extra amount of time you add to your best estimate of span time “just to be safe”. Example: Many software companies double their span time estimates. Don’t use fudge factors because of Parkinson’s law. If an activity takes 2 weeks, but you add a 50% fudge factor, chances are almost zero that it will be done in less then 3 weeks.

Слайд 41


Heuristics for dealing with time 1. First Set the Project Start Time => Determines the planned project time Determine the critical path(s) 2. Then...
Описание слайда:
Heuristics for dealing with time 1. First Set the Project Start Time => Determines the planned project time Determine the critical path(s) 2. Then try to reduce the planned project time If you want to get your project done in less time, you need to consider ways to shorten the aggregate time it takes to complete the critical path. Avoid fudge factors

Слайд 42


Identifying When a Project Goes Off-Track Determine what went wrong: Why is your project got off track? Behind schedule Overspending of resource...
Описание слайда:
Identifying When a Project Goes Off-Track Determine what went wrong: Why is your project got off track? Behind schedule Overspending of resource budgets Not producing the desired deliverables Identify the Reason(s): You are new on the job, this is your first project, and you made mistakes Key people left the teams or new ones are joining it Key people lost interest or new ones entered the picture The requirements have changed New technology has emerged The business objectives have changed Organizational priorities have shifted (for example after a merger)

Слайд 43


Heuristics to get a project back on track Reaffirm your plan Reaffirm your key people Reaffirm your project objectives Reaffirm the activities...
Описание слайда:
Heuristics to get a project back on track Reaffirm your plan Reaffirm your key people Reaffirm your project objectives Reaffirm the activities remaining to be done Reaffirm roles and responsibilities (Lecture on Project organization, May 7)) Refocus team direction and commitment Revise estimates, develop a viable schedule Modify your personnel assignments (May 7) Hold a midproject kickoff session Closely monitor and control performance for the remainder of the project (Lecture on Project Controlling, June 25) Get practical experience

Слайд 44


What makes a Software Project successful? User involvement 20 Support from upper management 15 Clear Business Objectives 15 Experienced Project...
Описание слайда:
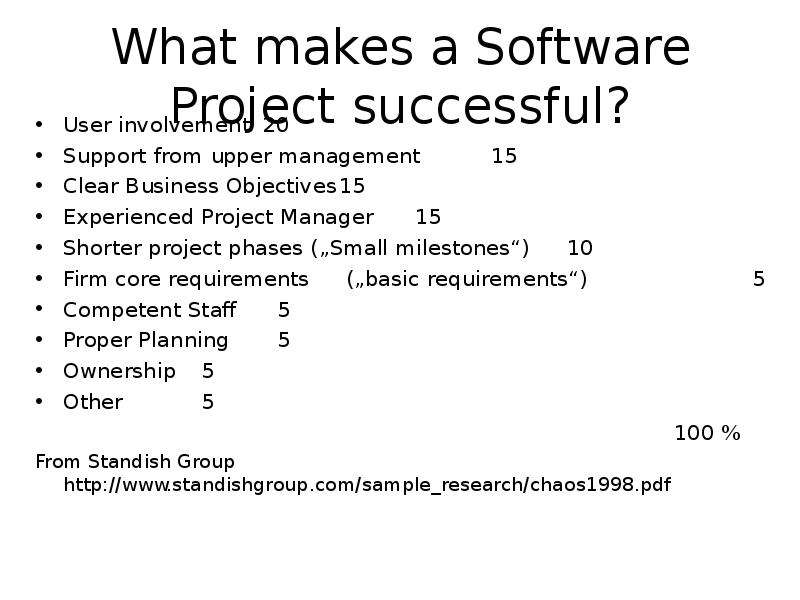
What makes a Software Project successful? User involvement 20 Support from upper management 15 Clear Business Objectives 15 Experienced Project Manager 15 Shorter project phases („Small milestones“) 10 Firm core requirements („basic requirements“) 5 Competent Staff 5 Proper Planning 5 Ownership 5 Other 5 100 % From Standish Group

Слайд 45


Become a better software project manager End User and Management involvement 35% Learn how to involve the customer and end users Learn how to get...
Описание слайда:
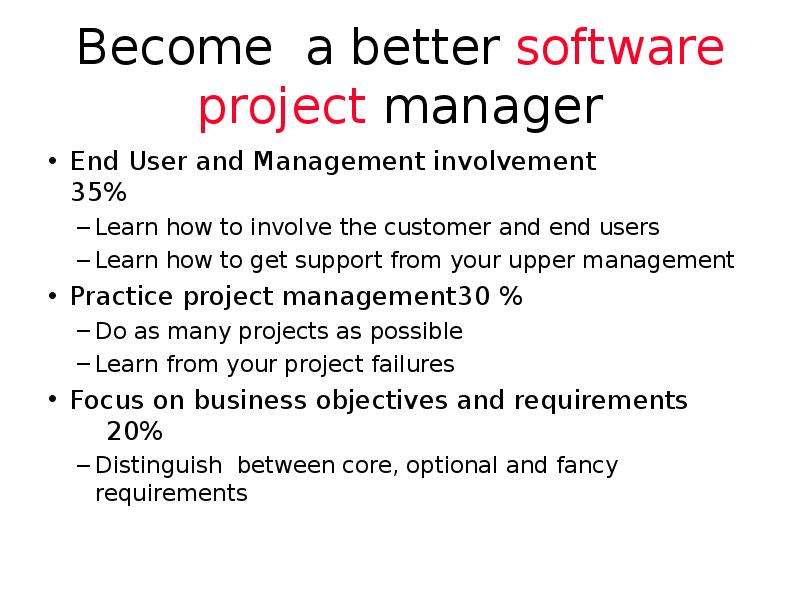
Become a better software project manager End User and Management involvement 35% Learn how to involve the customer and end users Learn how to get support from your upper management Practice project management 30 % Do as many projects as possible Learn from your project failures Focus on business objectives and requirements 20% Distinguish between core, optional and fancy requirements

Слайд 46


How to become a better project manager Don’t assume anything Take the time to find out the facts. Use assumptions only as a last resort. With every...
Описание слайда:
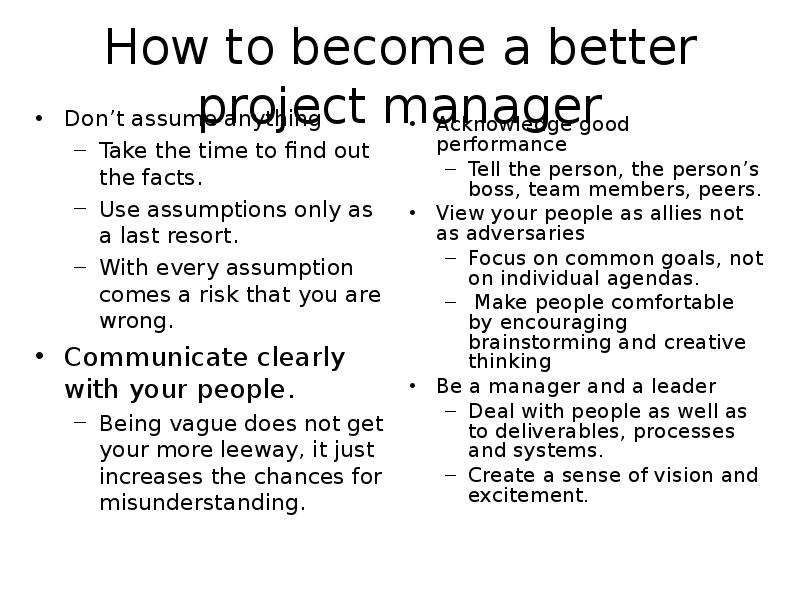
How to become a better project manager Don’t assume anything Take the time to find out the facts. Use assumptions only as a last resort. With every assumption comes a risk that you are wrong. Communicate clearly with your people. Being vague does not get your more leeway, it just increases the chances for misunderstanding.

Слайд 47


Additional Readings [IEEE Std 1058] Standard for Software Project Management Plans Stanley E Portny, Project Management for Dummies, Hungry Minds,...
Описание слайда:
Additional Readings [IEEE Std 1058] Standard for Software Project Management Plans Stanley E Portny, Project Management for Dummies, Hungry Minds, 2001, ISBN 0-7645-5283-X Standish Group: Chaos, Sample Research Paper, 1998 [Royse 1998], Software Project Management, Addison-Wesley, ISBN0-201-30958-0

Слайд 48


Summary Software Project Management Plan, Section 5: 5.1 Work Breakdown Structure 5.2 Dependencies between tasks 5.3 Resource Requirements (=>...
Описание слайда:
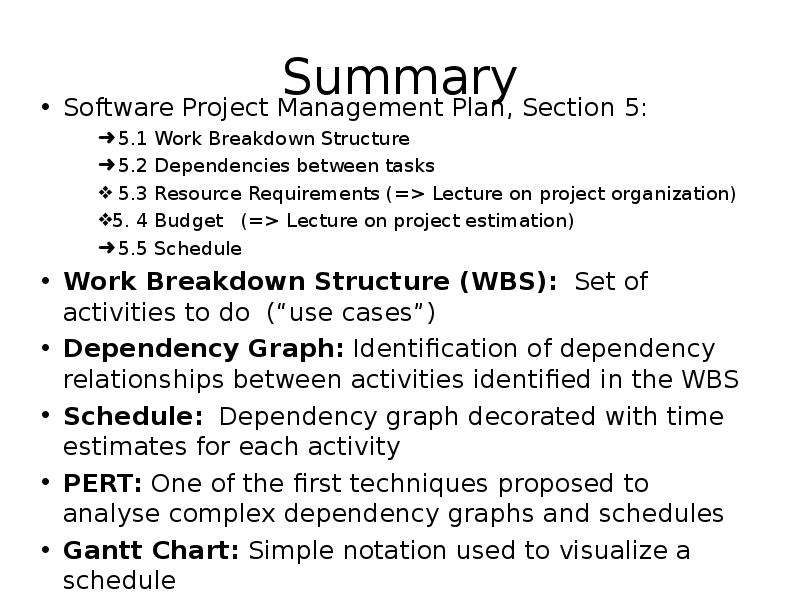
Summary Software Project Management Plan, Section 5: 5.1 Work Breakdown Structure 5.2 Dependencies between tasks 5.3 Resource Requirements (=> Lecture on project organization) 5. 4 Budget (=> Lecture on project estimation) 5.5 Schedule Work Breakdown Structure (WBS): Set of activities to do (“use cases”) Dependency Graph: Identification of dependency relationships between activities identified in the WBS Schedule: Dependency graph decorated with time estimates for each activity PERT: One of the first techniques proposed to analyse complex dependency graphs and schedules Gantt Chart: Simple notation used to visualize a schedule

Слайд 49


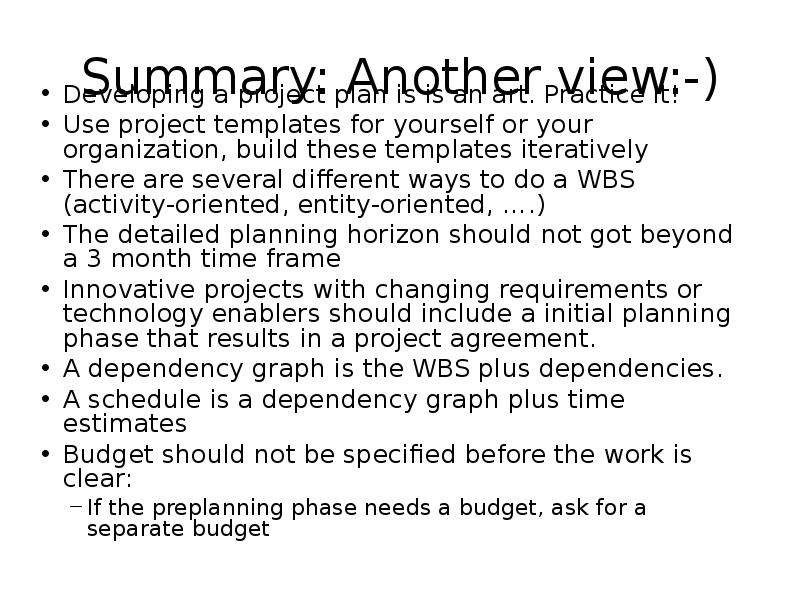
Summary: Another view:-) Developing a project plan is is an art. Practice it! Use project templates for yourself or your organization, build these...
Описание слайда:
Summary: Another view:-) Developing a project plan is is an art. Practice it! Use project templates for yourself or your organization, build these templates iteratively There are several different ways to do a WBS (activity-oriented, entity-oriented, ….) The detailed planning horizon should not got beyond a 3 month time frame Innovative projects with changing requirements or technology enablers should include a initial planning phase that results in a project agreement. A dependency graph is the WBS plus dependencies. A schedule is a dependency graph plus time estimates Budget should not be specified before the work is clear: If the preplanning phase needs a budget, ask for a separate budget


Похожие презентации
Mypresentation.ru
Загрузить презентацию