🗊Презентация Chapter 17. Options markets: introduction

Нажмите для полного просмотра!
Chapter 17. Options markets: introduction, слайд №1Chapter 17. Options markets: introduction, слайд №2Chapter 17. Options markets: introduction, слайд №3Chapter 17. Options markets: introduction, слайд №4Chapter 17. Options markets: introduction, слайд №5Chapter 17. Options markets: introduction, слайд №6Chapter 17. Options markets: introduction, слайд №7Chapter 17. Options markets: introduction, слайд №8Chapter 17. Options markets: introduction, слайд №9Chapter 17. Options markets: introduction, слайд №10Chapter 17. Options markets: introduction, слайд №11Chapter 17. Options markets: introduction, слайд №12Chapter 17. Options markets: introduction, слайд №13Chapter 17. Options markets: introduction, слайд №14Chapter 17. Options markets: introduction, слайд №15Chapter 17. Options markets: introduction, слайд №16Chapter 17. Options markets: introduction, слайд №17Chapter 17. Options markets: introduction, слайд №18Chapter 17. Options markets: introduction, слайд №19Chapter 17. Options markets: introduction, слайд №20Chapter 17. Options markets: introduction, слайд №21Chapter 17. Options markets: introduction, слайд №22Chapter 17. Options markets: introduction, слайд №23Chapter 17. Options markets: introduction, слайд №24Chapter 17. Options markets: introduction, слайд №25Chapter 17. Options markets: introduction, слайд №26Chapter 17. Options markets: introduction, слайд №27Chapter 17. Options markets: introduction, слайд №28Chapter 17. Options markets: introduction, слайд №29Chapter 17. Options markets: introduction, слайд №30Chapter 17. Options markets: introduction, слайд №31Chapter 17. Options markets: introduction, слайд №32Chapter 17. Options markets: introduction, слайд №33Chapter 17. Options markets: introduction, слайд №34Chapter 17. Options markets: introduction, слайд №35Chapter 17. Options markets: introduction, слайд №36Chapter 17. Options markets: introduction, слайд №37Chapter 17. Options markets: introduction, слайд №38Chapter 17. Options markets: introduction, слайд №39Chapter 17. Options markets: introduction, слайд №40Chapter 17. Options markets: introduction, слайд №41Chapter 17. Options markets: introduction, слайд №42Chapter 17. Options markets: introduction, слайд №43Chapter 17. Options markets: introduction, слайд №44

Содержание
Вы можете ознакомиться и скачать презентацию на тему Chapter 17. Options markets: introduction. Доклад-сообщение содержит 44 слайдов. Презентации для любого класса можно скачать бесплатно. Если материал и наш сайт презентаций Mypresentation Вам понравились – поделитесь им с друзьями с помощью социальных кнопок и добавьте в закладки в своем браузере.
Слайды и текст этой презентации


Слайд 1


CHAPTER 17
Options Markets: Introduction (44 slides)
Описание слайда:
CHAPTER 17 Options Markets: Introduction (44 slides)

Слайд 2


Options
Derivatives are securities that get their value from the price of other securities.
Derivatives are contingent claims because their payoffs depend on the value of other securities.
Options are traded both on organized exchanges and OTC. Chinese currency option next page
Описание слайда:
Options Derivatives are securities that get their value from the price of other securities. Derivatives are contingent claims because their payoffs depend on the value of other securities. Options are traded both on organized exchanges and OTC. Chinese currency option next page

Слайд 3


Chinese Currency options
Описание слайда:
Chinese Currency options

Слайд 4


The Option Contract: Calls
A call option gives its holder the right to buy an asset: example next page
At the exercise or strike price
On or before the expiration date
Exercise the option to buy the underlying asset if market value > strike.
Описание слайда:
The Option Contract: Calls A call option gives its holder the right to buy an asset: example next page At the exercise or strike price On or before the expiration date Exercise the option to buy the underlying asset if market value > strike.

Слайд 5


Option quotation
Описание слайда:
Option quotation

Слайд 6


Warrants in Hong Kong
Warrant Terms and Indicators
Warrant Name South Africa A Goldman thirty-two
Publisher Goldman Sachs
Related assets South A50
Warrant Price (HKD) 0.040
Change (%) 8.11
Warrant Type Ordinary Warrant
Exercise price 10.80
Underlying Price 9.49
Turnover ($) 600
Call / Put Subscription
ITM / OTM (%) 13.8% (OTM)
Maturity (Year - Month - Day) 2013-12-30
Last Trading Date (Year - Month - Day) 2013-12-19
Maturity 67
Conversion Ratio 1
Lot Size 2,000
Technical information
Gearing (x) 237.25
Premium% (break-even price) 14.23% (10.840)
Effective Gearing (x) 22.87
Implied Volatility 22.08
Over the past 30 days Underlying Historical Volatility Not applicable
Delta 9.64
Outstanding Ratio% 30.40%
Time loss value -4.02
Technical information
Описание слайда:
Warrants in Hong Kong Warrant Terms and Indicators Warrant Name South Africa A Goldman thirty-two Publisher Goldman Sachs Related assets South A50 Warrant Price (HKD) 0.040 Change (%) 8.11 Warrant Type Ordinary Warrant Exercise price 10.80 Underlying Price 9.49 Turnover ($) 600 Call / Put Subscription ITM / OTM (%) 13.8% (OTM) Maturity (Year - Month - Day) 2013-12-30 Last Trading Date (Year - Month - Day) 2013-12-19 Maturity 67 Conversion Ratio 1 Lot Size 2,000 Technical information Gearing (x) 237.25 Premium% (break-even price) 14.23% (10.840) Effective Gearing (x) 22.87 Implied Volatility 22.08 Over the past 30 days Underlying Historical Volatility Not applicable Delta 9.64 Outstanding Ratio% 30.40% Time loss value -4.02 Technical information

Слайд 7


The Chinese Warrants Bubble, by Wei Xiong et al.

In 2005-2008, over a dozen put warrants traded in China went so deep out of the money that they were almost certain to expire worthless. Nonetheless, each warrant was traded more than three times each day at substantially inflated prices. This bubble is unique in that the underlying stock prices make warrant fundamentals publicly observable and that warrants have predetermined finite maturities. This sample allows us to examine a set of bubble theories. In particular, our analysis highlights the joint effects of short-sales constraints and heterogeneous beliefs in driving bubbles and confirms several key findings of the experimental bubble literature. (JEL G12, G13, O16, P34)
Описание слайда:
The Chinese Warrants Bubble, by Wei Xiong et al. In 2005-2008, over a dozen put warrants traded in China went so deep out of the money that they were almost certain to expire worthless. Nonetheless, each warrant was traded more than three times each day at substantially inflated prices. This bubble is unique in that the underlying stock prices make warrant fundamentals publicly observable and that warrants have predetermined finite maturities. This sample allows us to examine a set of bubble theories. In particular, our analysis highlights the joint effects of short-sales constraints and heterogeneous beliefs in driving bubbles and confirms several key findings of the experimental bubble literature. (JEL G12, G13, O16, P34)

Слайд 8


The Option Contract: Puts
A put option gives its holder the right to sell an asset:
At the exercise or strike price
On or before the expiration date
Exercise the option to sell the underlying asset if market value < strike.
Описание слайда:
The Option Contract: Puts A put option gives its holder the right to sell an asset: At the exercise or strike price On or before the expiration date Exercise the option to sell the underlying asset if market value < strike.

Слайд 9


The Option Contract
The purchase price of the option is called the premium.
Sellers (writers) of options receive premium income.
If holder exercises the option, the option writer must make (call) or take (put) delivery of the underlying asset.
Описание слайда:
The Option Contract The purchase price of the option is called the premium. Sellers (writers) of options receive premium income. If holder exercises the option, the option writer must make (call) or take (put) delivery of the underlying asset.

Слайд 10


Example 17.1 Profit and Loss on a Call
A January 2010 call on IBM with an exercise price of $130 was selling on December 2, 2009, for $2.18.
The option expires on the third Friday of the month, or January 15, 2010.
If IBM remains below $130, the call will expire worthless.
Описание слайда:
Example 17.1 Profit and Loss on a Call A January 2010 call on IBM with an exercise price of $130 was selling on December 2, 2009, for $2.18. The option expires on the third Friday of the month, or January 15, 2010. If IBM remains below $130, the call will expire worthless.

Слайд 11


Example 17.1 Profit and Loss on a Call
Suppose IBM sells for $132 on the expiration date.
Option value = stock price-exercise price
$132- $130= $2
Profit = Final value – Original investment
$2.00 - $2.18 = -$0.18
Option will be exercised to offset loss of premium.
Call will not be strictly profitable unless IBM’s price exceeds $132.18 (strike + premium) by expiration.
Описание слайда:
Example 17.1 Profit and Loss on a Call Suppose IBM sells for $132 on the expiration date. Option value = stock price-exercise price $132- $130= $2 Profit = Final value – Original investment $2.00 - $2.18 = -$0.18 Option will be exercised to offset loss of premium. Call will not be strictly profitable unless IBM’s price exceeds $132.18 (strike + premium) by expiration.

Слайд 12


Example 17.2 Profit and Loss on a Put
Consider a January 2010 put on IBM with an exercise price of $130, selling on December 2, 2009, for $4.79.
Option holder can sell a share of IBM for $130 at any time until January 15.
If IBM goes above $130, the put is worthless.
Описание слайда:
Example 17.2 Profit and Loss on a Put Consider a January 2010 put on IBM with an exercise price of $130, selling on December 2, 2009, for $4.79. Option holder can sell a share of IBM for $130 at any time until January 15. If IBM goes above $130, the put is worthless.

Слайд 13


Example 17.2 Profit and Loss on a Put
Suppose IBM’s price at expiration is $123.
Value at expiration = exercise price – stock price:
$130 - $123 = $7
Investor’s profit:
$7.00 - $4.79 = $2.21
Holding period return = 46.1% over 44 days!
Описание слайда:
Example 17.2 Profit and Loss on a Put Suppose IBM’s price at expiration is $123. Value at expiration = exercise price – stock price: $130 - $123 = $7 Investor’s profit: $7.00 - $4.79 = $2.21 Holding period return = 46.1% over 44 days!

Слайд 14


Market and Exercise Price Relationships
In the Money - exercise of the option would be profitable
	Call:  exercise price < market price
	Put:  exercise price > market price
Out of the Money - exercise of the option would not be profitable
	Call:  market price < exercise price.
	Put: market price > exercise price.
At the Money - exercise price and asset price are equal
Описание слайда:
Market and Exercise Price Relationships In the Money - exercise of the option would be profitable Call: exercise price < market price Put: exercise price > market price Out of the Money - exercise of the option would not be profitable Call: market price < exercise price. Put: market price > exercise price. At the Money - exercise price and asset price are equal

Слайд 15


American vs. European Options
American - the option can be exercised at any time before expiration or maturity
European - the option can only be exercised on the expiration or maturity date
In the U.S., most options are American style, except for currency and stock index options.
Описание слайда:
American vs. European Options American - the option can be exercised at any time before expiration or maturity European - the option can only be exercised on the expiration or maturity date In the U.S., most options are American style, except for currency and stock index options.

Слайд 16


Different Types of Options
Stock Options
Index Options
Futures Options
Foreign Currency Options (e.g. Chinese Currency options)
Interest Rate Options
Описание слайда:
Different Types of Options Stock Options Index Options Futures Options Foreign Currency Options (e.g. Chinese Currency options) Interest Rate Options

Слайд 17


Payoffs and Profits at Expiration - Calls
Notation
  Stock Price = ST   Exercise Price = X
Payoff to Call Holder 
	 (ST - X) 	if ST >X
	      0	if ST < X
Profit to Call Holder
	Payoff - Purchase Price
Описание слайда:
Payoffs and Profits at Expiration - Calls Notation Stock Price = ST Exercise Price = X Payoff to Call Holder (ST - X) if ST >X 0 if ST < X Profit to Call Holder Payoff - Purchase Price

Слайд 18


Payoffs and Profits at Expiration - Calls
Payoff to Call Writer 
	- (ST - X) 	if ST >X
	      0	if ST < X
Profit to Call Writer
		Payoff + Premium
Описание слайда:
Payoffs and Profits at Expiration - Calls Payoff to Call Writer - (ST - X) if ST >X 0 if ST < X Profit to Call Writer Payoff + Premium

Слайд 19


Figure 17.2 Payoff and Profit to Call Option at Expiration
Описание слайда:
Figure 17.2 Payoff and Profit to Call Option at Expiration

Слайд 20


Figure 17.3 Payoff and Profit to Call Writers at Expiration
Описание слайда:
Figure 17.3 Payoff and Profit to Call Writers at Expiration

Слайд 21


Payoffs and Profits at Expiration - Puts
Payoffs to Put Holder
		0		if  ST  >  X
	(X - ST) 		if  ST  <  X
Profit to Put Holder 
		Payoff - Premium
Описание слайда:
Payoffs and Profits at Expiration - Puts Payoffs to Put Holder 0 if ST > X (X - ST) if ST < X Profit to Put Holder Payoff - Premium

Слайд 22


Payoffs and Profits at Expiration – Puts
Payoffs to Put Writer
		0		if   ST > X
	-(X - ST)		if   ST < X
Profits to Put Writer
		Payoff + Premium
Описание слайда:
Payoffs and Profits at Expiration – Puts Payoffs to Put Writer 0 if ST > X -(X - ST) if ST < X Profits to Put Writer Payoff + Premium

Слайд 23


Figure 17.4 Payoff and Profit to Put Option at Expiration
Описание слайда:
Figure 17.4 Payoff and Profit to Put Option at Expiration

Слайд 24


Option versus Stock Investments
Could a call option strategy be preferable to a direct stock purchase? 
Suppose you think a stock, currently selling for $100, will appreciate. 
A 6-month call costs $10 (contract size is 100 shares).
You have $10,000 to invest.
Описание слайда:
Option versus Stock Investments Could a call option strategy be preferable to a direct stock purchase? Suppose you think a stock, currently selling for $100, will appreciate. A 6-month call costs $10 (contract size is 100 shares). You have $10,000 to invest.

Слайд 25


Option versus Stock Investments
Strategy A: Invest entirely in stock. Buy 100 shares, each selling for $100.
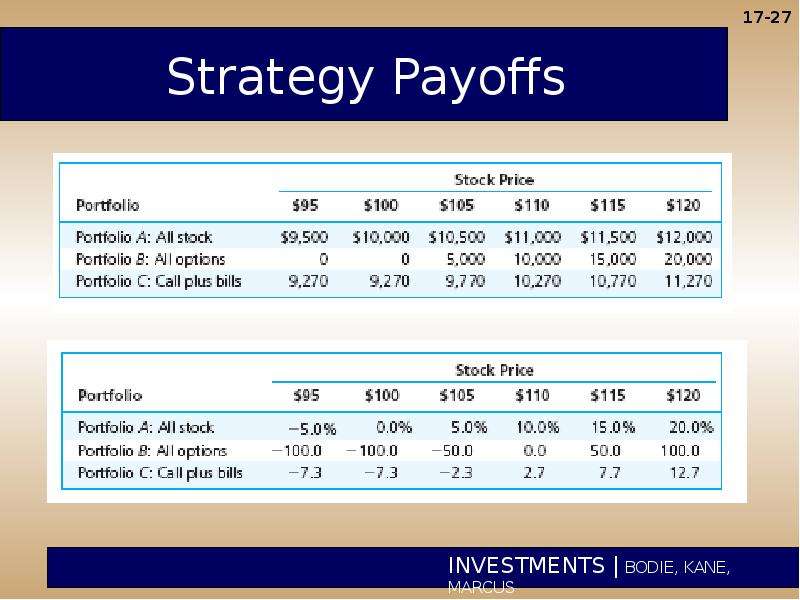
Strategy B: Invest entirely in at-the-money call options. Buy 1,000 calls, each selling for $10. (This would require 10 contracts, each for 100 shares.)
Strategy C: Purchase 100 call options for $1,000. Invest your remaining $9,000 in 6-month T-bills, to earn 3% interest. The bills will be worth $9,270 at expiration.
Описание слайда:
Option versus Stock Investments Strategy A: Invest entirely in stock. Buy 100 shares, each selling for $100. Strategy B: Invest entirely in at-the-money call options. Buy 1,000 calls, each selling for $10. (This would require 10 contracts, each for 100 shares.) Strategy C: Purchase 100 call options for $1,000. Invest your remaining $9,000 in 6-month T-bills, to earn 3% interest. The bills will be worth $9,270 at expiration.

Слайд 26


Option versus Stock Investment
Описание слайда:
Option versus Stock Investment

Слайд 27


Strategy Payoffs
Описание слайда:
Strategy Payoffs

Слайд 28


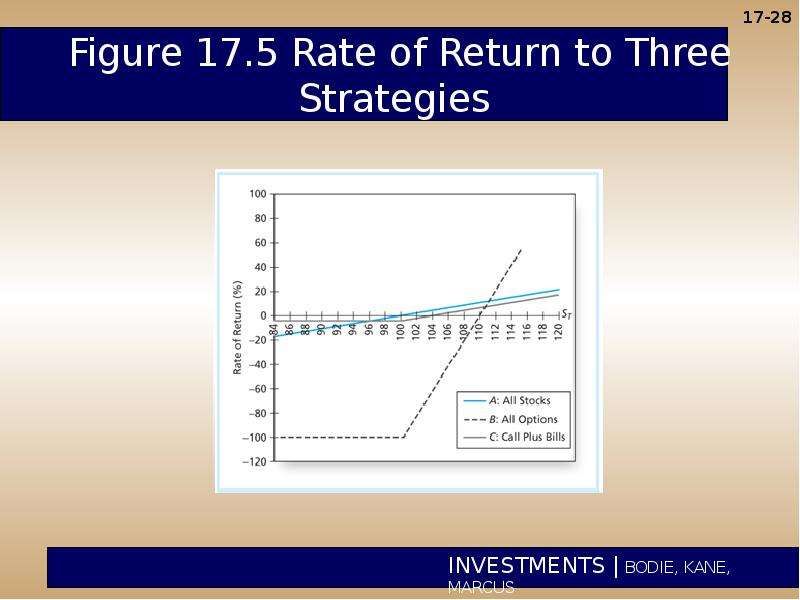
Figure 17.5 Rate of Return to Three Strategies
Описание слайда:
Figure 17.5 Rate of Return to Three Strategies

Слайд 29


Strategy Conclusions
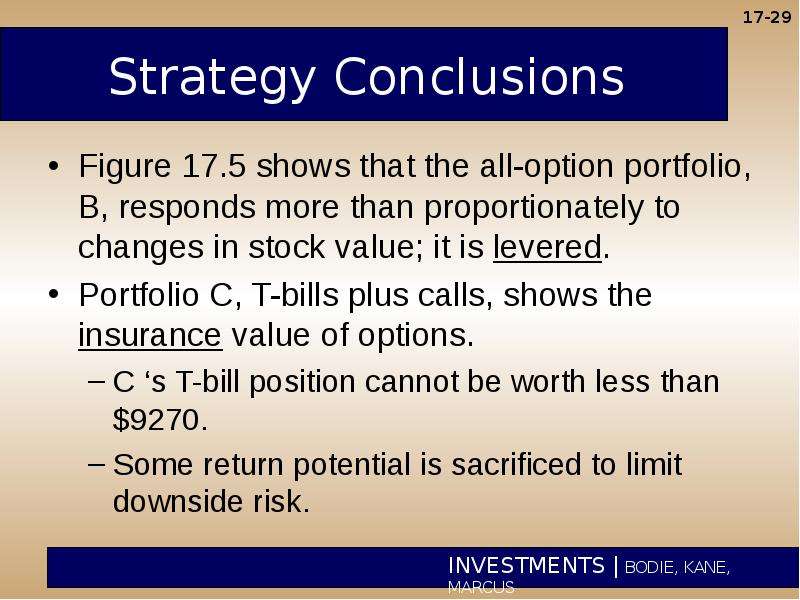
Figure 17.5 shows that the all-option portfolio, B, responds more than proportionately to changes in stock value; it is levered.
Portfolio C, T-bills plus calls, shows the insurance value of options.
C ‘s T-bill position cannot be worth less than $9270.
Some return potential is sacrificed to limit downside risk.
Описание слайда:
Strategy Conclusions Figure 17.5 shows that the all-option portfolio, B, responds more than proportionately to changes in stock value; it is levered. Portfolio C, T-bills plus calls, shows the insurance value of options. C ‘s T-bill position cannot be worth less than $9270. Some return potential is sacrificed to limit downside risk.

Слайд 30


Protective Put Conclusions
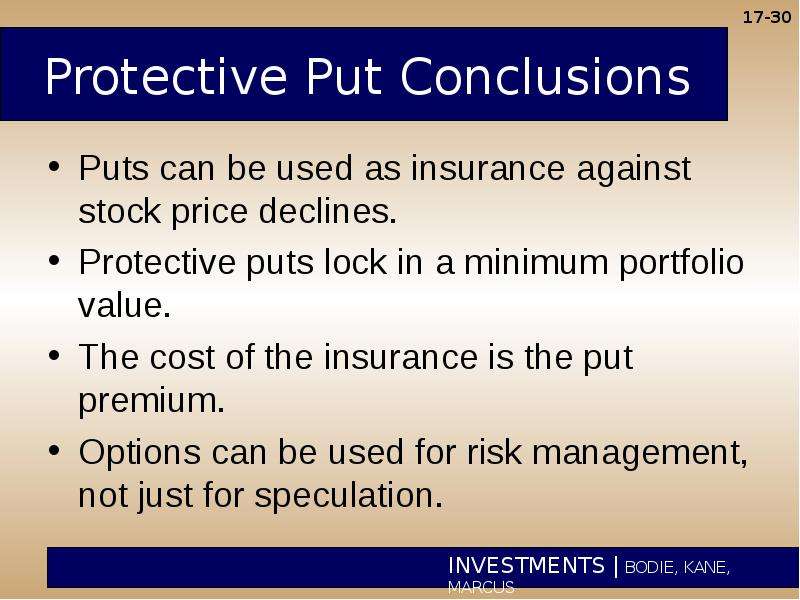
Puts can be used as insurance against stock price declines.
Protective puts lock in a minimum portfolio value.
The cost of the insurance is the put premium.
Options can be used for risk management, not just for speculation.
Описание слайда:
Protective Put Conclusions Puts can be used as insurance against stock price declines. Protective puts lock in a minimum portfolio value. The cost of the insurance is the put premium. Options can be used for risk management, not just for speculation.

Слайд 31


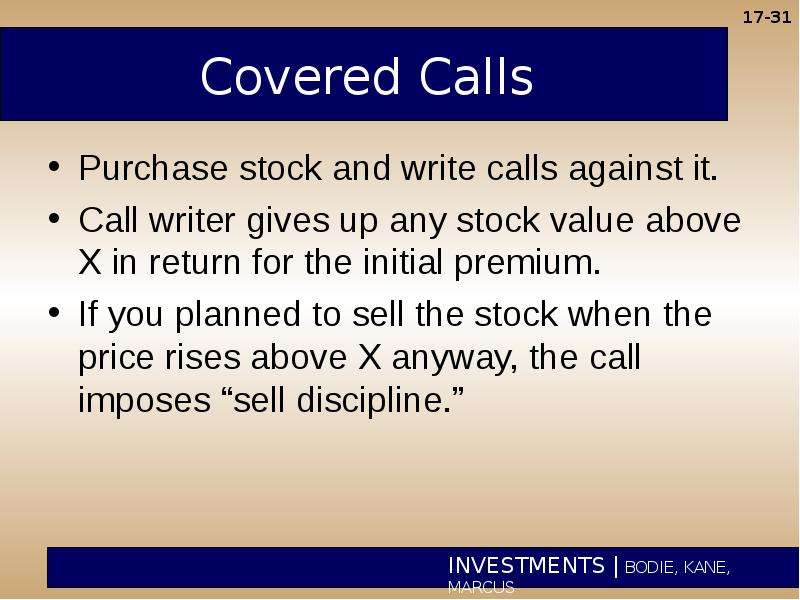
Covered Calls
Purchase stock and write calls against it.
Call writer gives up any stock value above X in return for the initial premium. 
If you planned to sell the stock when the price rises above X anyway, the call imposes “sell discipline.”
Описание слайда:
Covered Calls Purchase stock and write calls against it. Call writer gives up any stock value above X in return for the initial premium. If you planned to sell the stock when the price rises above X anyway, the call imposes “sell discipline.”

Слайд 32


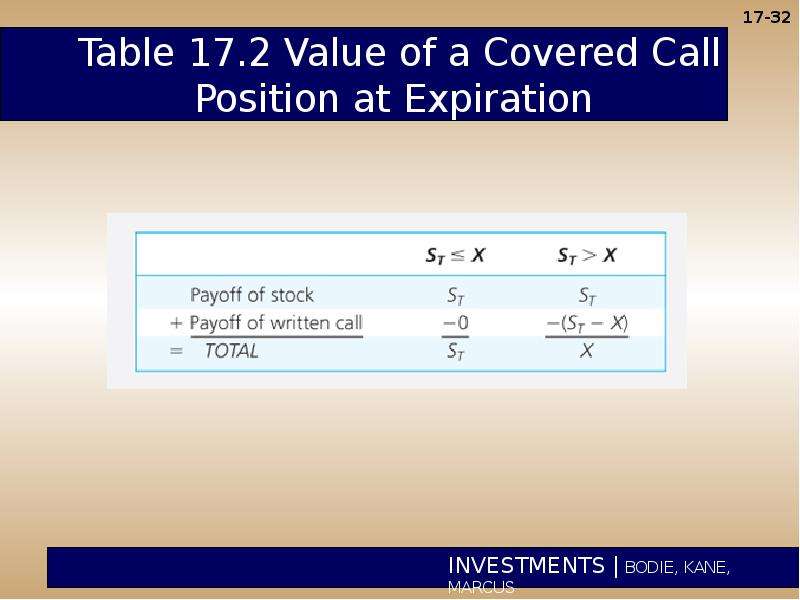
Table 17.2 Value of a Covered Call Position at Expiration
Описание слайда:
Table 17.2 Value of a Covered Call Position at Expiration

Слайд 33


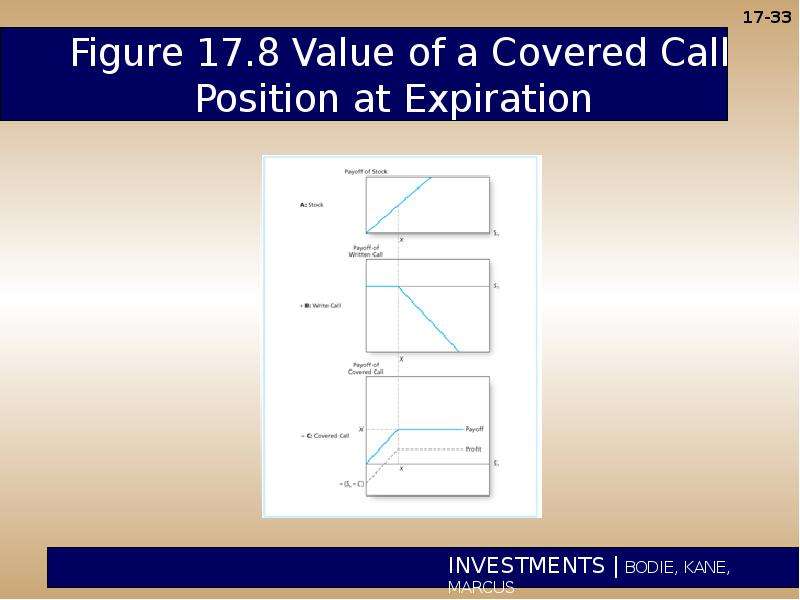
Figure 17.8 Value of a Covered Call Position at Expiration
Описание слайда:
Figure 17.8 Value of a Covered Call Position at Expiration

Слайд 34


Straddle
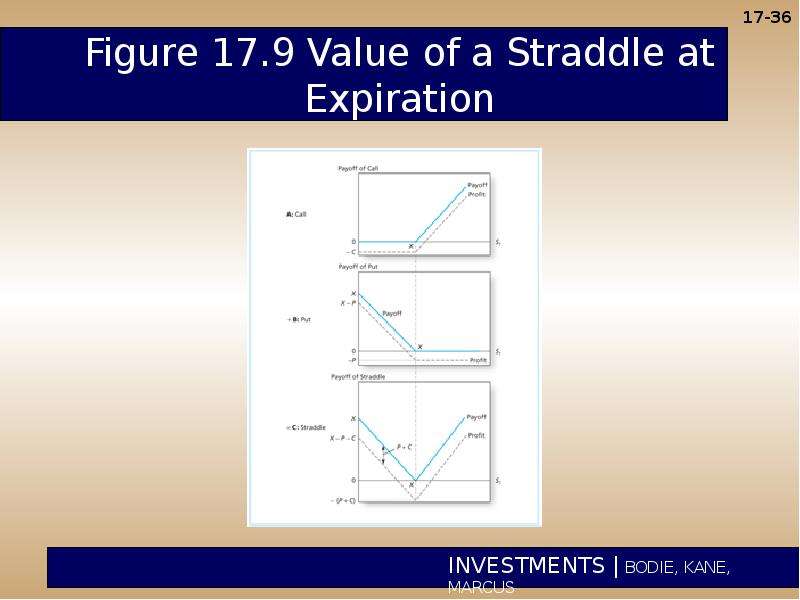
Long straddle: Buy call and put with same exercise price and maturity.
The straddle is a bet on volatility.
To make a profit, the change in stock price must exceed the cost of both options.
You need a strong change in stock price in either direction.
The writer of a straddle is betting the stock price will not change much.
Описание слайда:
Straddle Long straddle: Buy call and put with same exercise price and maturity. The straddle is a bet on volatility. To make a profit, the change in stock price must exceed the cost of both options. You need a strong change in stock price in either direction. The writer of a straddle is betting the stock price will not change much.

Слайд 35


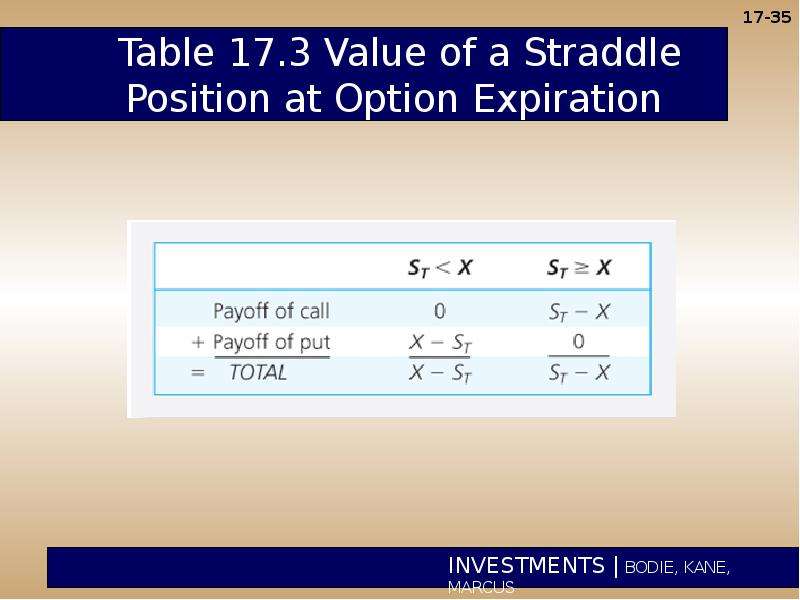
Table 17.3 Value of a Straddle Position at Option Expiration
Описание слайда:
Table 17.3 Value of a Straddle Position at Option Expiration

Слайд 36


Figure 17.9 Value of a Straddle at Expiration
Описание слайда:
Figure 17.9 Value of a Straddle at Expiration

Слайд 37


Spreads
A spread is a combination of two or more calls (or two or more puts) on the same stock with differing exercise prices or times to maturity.
Описание слайда:
Spreads A spread is a combination of two or more calls (or two or more puts) on the same stock with differing exercise prices or times to maturity.

Слайд 38


Table 17.4 Value of a Bullish Spread Position at Expiration
Описание слайда:
Table 17.4 Value of a Bullish Spread Position at Expiration

Слайд 39


Figure 17.10 Value of a Bullish Spread Position at Expiration
Описание слайда:
Figure 17.10 Value of a Bullish Spread Position at Expiration

Слайд 40


Collars
A collar is an options strategy that brackets the value of a portfolio between two bounds.
Limit downside risk by selling upside potential.
Buy a protective put to limit downside risk of a position. 
Fund put purchase by writing a covered call.
Net outlay for options is approximately zero.
Описание слайда:
Collars A collar is an options strategy that brackets the value of a portfolio between two bounds. Limit downside risk by selling upside potential. Buy a protective put to limit downside risk of a position. Fund put purchase by writing a covered call. Net outlay for options is approximately zero.

Слайд 41


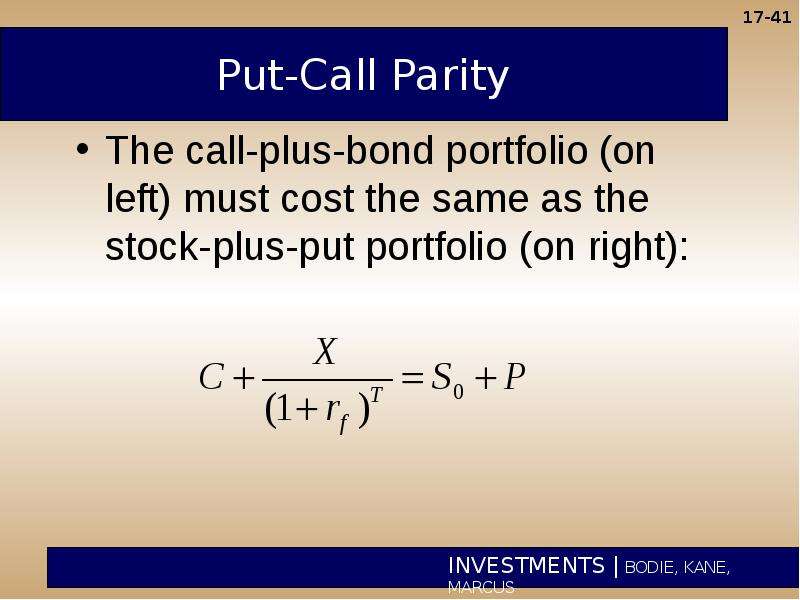
Put-Call Parity
The call-plus-bond portfolio (on left) must cost the same as the stock-plus-put portfolio (on right):
Описание слайда:
Put-Call Parity The call-plus-bond portfolio (on left) must cost the same as the stock-plus-put portfolio (on right):

Слайд 42


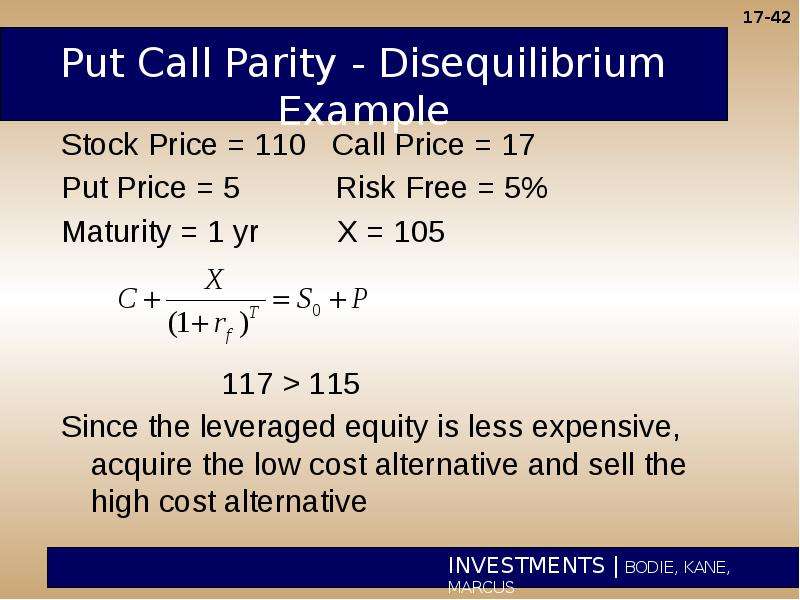
Put Call Parity - Disequilibrium Example
Stock Price = 110   Call Price = 17
Put Price = 5           Risk Free = 5%
Maturity = 1 yr         X = 105


			117 > 115
Since the leveraged equity is less expensive, acquire the low cost alternative and sell the high cost alternative
Описание слайда:
Put Call Parity - Disequilibrium Example Stock Price = 110 Call Price = 17 Put Price = 5 Risk Free = 5% Maturity = 1 yr X = 105 117 > 115 Since the leveraged equity is less expensive, acquire the low cost alternative and sell the high cost alternative

Слайд 43


Table 17.5 Arbitrage Strategy
Описание слайда:
Table 17.5 Arbitrage Strategy

Слайд 44


Option-like Securities
Callable Bonds
Convertible Securities
Warrants
Collateralized Loans
Описание слайда:
Option-like Securities Callable Bonds Convertible Securities Warrants Collateralized Loans


Похожие презентации
Mypresentation.ru
Загрузить презентацию