🗊Презентация Management Tools. Problem Solving

Категория: Менеджмент
Нажмите для полного просмотра!
Management Tools. Problem Solving, слайд №1Management Tools. Problem Solving, слайд №2Management Tools. Problem Solving, слайд №3Management Tools. Problem Solving, слайд №4Management Tools. Problem Solving, слайд №5Management Tools. Problem Solving, слайд №6Management Tools. Problem Solving, слайд №7Management Tools. Problem Solving, слайд №8Management Tools. Problem Solving, слайд №9Management Tools. Problem Solving, слайд №10Management Tools. Problem Solving, слайд №11Management Tools. Problem Solving, слайд №12Management Tools. Problem Solving, слайд №13Management Tools. Problem Solving, слайд №14Management Tools. Problem Solving, слайд №15Management Tools. Problem Solving, слайд №16Management Tools. Problem Solving, слайд №17Management Tools. Problem Solving, слайд №18Management Tools. Problem Solving, слайд №19Management Tools. Problem Solving, слайд №20Management Tools. Problem Solving, слайд №21Management Tools. Problem Solving, слайд №22Management Tools. Problem Solving, слайд №23Management Tools. Problem Solving, слайд №24Management Tools. Problem Solving, слайд №25

Вы можете ознакомиться и скачать презентацию на тему Management Tools. Problem Solving. Доклад-сообщение содержит 25 слайдов. Презентации для любого класса можно скачать бесплатно. Если материал и наш сайт презентаций Mypresentation Вам понравились – поделитесь им с друзьями с помощью социальных кнопок и добавьте в закладки в своем браузере.

Слайды и текст этой презентации


Слайд 1


Management Tools

 Problem Solving 
					Chapter 17
Doug Winter, Christy Blew, Anh Le, Jennifer Stoltz
Описание слайда:
Management Tools Problem Solving Chapter 17 Doug Winter, Christy Blew, Anh Le, Jennifer Stoltz

Слайд 2


The “Why Why” Tool…
Описание слайда:
The “Why Why” Tool…

Слайд 3


The “Why Why” Tool…
Why did the customer return the product?
It had a faulty component

Why did it have a faulty component?
It was machined wrong

Why was it machined wrong?
The calibration was off

Why was the calibration off?
Описание слайда:
The “Why Why” Tool… Why did the customer return the product? It had a faulty component Why did it have a faulty component? It was machined wrong Why was it machined wrong? The calibration was off Why was the calibration off?

Слайд 4


Forced Field Analysis…
Identify the forces and factors that may influence the problem or goal

State current situation, problem, or desired state. 

List all the forces driving change and restraining change (from the current state, or to the desired state) 

Explore each force -- are they valid, what is behind them, and can they be changed? 

Determine the strength of each force using an evaluative scale (e.g. High-Medium-Low or 1-10 with 1 being extremely weak top to bottom listing) 

A graphical presentation of the forces and their relative strength is useful in visualizing the dynamics of the situation and what change is viable. 

Develop action plans to reduce restraining forces and increasing driving forces. 
Описание слайда:
Forced Field Analysis… Identify the forces and factors that may influence the problem or goal State current situation, problem, or desired state. List all the forces driving change and restraining change (from the current state, or to the desired state) Explore each force -- are they valid, what is behind them, and can they be changed? Determine the strength of each force using an evaluative scale (e.g. High-Medium-Low or 1-10 with 1 being extremely weak top to bottom listing) A graphical presentation of the forces and their relative strength is useful in visualizing the dynamics of the situation and what change is viable. Develop action plans to reduce restraining forces and increasing driving forces. 

Слайд 5


Forced Field Analysis…
Описание слайда:
Forced Field Analysis…

Слайд 6


Nominal Group Technique…
Everyone submits problem they think is most important
Problems are listed 
Each member ranks all problems
Rankings given numerical value in regards to importance
Описание слайда:
Nominal Group Technique… Everyone submits problem they think is most important Problems are listed Each member ranks all problems Rankings given numerical value in regards to importance

Слайд 7


--- REVIEW ---
The canning factory that you are in management for is being faced with the possibility of downsizing and lay-offs of several hundred employees.

Use the WHY WHY Tool to determine the main reason for this situation.

Use FORCED FIELD ANALYSIS to meet the objective to avoid lay-offs.
Описание слайда:
--- REVIEW --- The canning factory that you are in management for is being faced with the possibility of downsizing and lay-offs of several hundred employees. Use the WHY WHY Tool to determine the main reason for this situation. Use FORCED FIELD ANALYSIS to meet the objective to avoid lay-offs.

Слайд 8


Affinity Diagram…
Conduct a brainstorming session on the topic under investigation. 

Clarify the list of ideas. Record them on small cards or Post-It notes. 

Randomly lay out cards on a table, flipchart, wall, etc. 

Without speaking, sort the cards into "similar" groups based on your gut reaction. If you don't like the placement of a particular card, move it. Continue until consensus is reached. 

Create header cards consisting of a concise 3-5 word description; the unifying concept for the group. Place header card at top of each group. 

Discuss the groupings and try to understand how the groups relate to each other.
Описание слайда:
Affinity Diagram… Conduct a brainstorming session on the topic under investigation. Clarify the list of ideas. Record them on small cards or Post-It notes. Randomly lay out cards on a table, flipchart, wall, etc. Without speaking, sort the cards into "similar" groups based on your gut reaction. If you don't like the placement of a particular card, move it. Continue until consensus is reached. Create header cards consisting of a concise 3-5 word description; the unifying concept for the group. Place header card at top of each group. Discuss the groupings and try to understand how the groups relate to each other.

Слайд 9


Affinity Diagram…
Описание слайда:
Affinity Diagram…

Слайд 10


Interrelationship Digraph…
Описание слайда:
Interrelationship Digraph…

Слайд 11


Interrelationship Digraph…
Описание слайда:
Interrelationship Digraph…

Слайд 12


Management Tools. Problem Solving, слайд №12
Описание слайда:

Слайд 13


--- REVIEW ---
and present
Your company has to shut down a main production line.
Create an AFFINITY DIAGRAM to decide which line will be the one that gets shut down.
Your company is trying to implement a new rewards programs for employee moral.
Create an INTERRELATION DIAGRAPH to come up with the best kind of program for your employees.
Описание слайда:
--- REVIEW --- and present Your company has to shut down a main production line. Create an AFFINITY DIAGRAM to decide which line will be the one that gets shut down. Your company is trying to implement a new rewards programs for employee moral. Create an INTERRELATION DIAGRAPH to come up with the best kind of program for your employees.

Слайд 14


Management Tools. Problem Solving, слайд №14
Описание слайда:

Слайд 15


“7 Management and 
Planning Tools”
Affinity Diagram
Interrelationship Diagraph

Tree Diagram
Matrix Diagram
Prioritization Methods
Process Decision Program Chart
Activity Network Diagram
Описание слайда:
“7 Management and Planning Tools” Affinity Diagram Interrelationship Diagraph Tree Diagram Matrix Diagram Prioritization Methods Process Decision Program Chart Activity Network Diagram

Слайд 16


Tree Diagrams…
Описание слайда:
Tree Diagrams…

Слайд 17


Matrix Diagrams…
Описание слайда:
Matrix Diagrams…

Слайд 18


Prioritization Matrices…
Описание слайда:
Prioritization Matrices…

Слайд 19


Process Decision Program Chart…
Описание слайда:
Process Decision Program Chart…

Слайд 20


Activity Network Diagram…
Описание слайда:
Activity Network Diagram…

Слайд 21


Management Tools. Problem Solving, слайд №21
Описание слайда:

Слайд 22


--- APPLY IT ---
The continuing conflict in the Middle East has raised commodity prices to record levels which is threatening to put your company financially under.

What is the greatest impact to your company?

Using the tools reviewed, work toward a solution that will help your company resolve this problem.
Описание слайда:
--- APPLY IT --- The continuing conflict in the Middle East has raised commodity prices to record levels which is threatening to put your company financially under. What is the greatest impact to your company? Using the tools reviewed, work toward a solution that will help your company resolve this problem.

Слайд 23


--- DISCUSS IT ---
What tool did you use?
Did you try a tool that didn’t work? Why didn’t it?
How easy/hard was it to apply the tool to meet your goal?
Описание слайда:
--- DISCUSS IT --- What tool did you use? Did you try a tool that didn’t work? Why didn’t it? How easy/hard was it to apply the tool to meet your goal?

Слайд 24


--- CONCLUSION ---
10 Tools Presented
First 3 can be used in variety of situations
Last 7 are known as “7 Management and Planning Tools”
These tools are most effective when used as a system to implement an improvement plan
Описание слайда:
--- CONCLUSION --- 10 Tools Presented First 3 can be used in variety of situations Last 7 are known as “7 Management and Planning Tools” These tools are most effective when used as a system to implement an improvement plan

Слайд 25


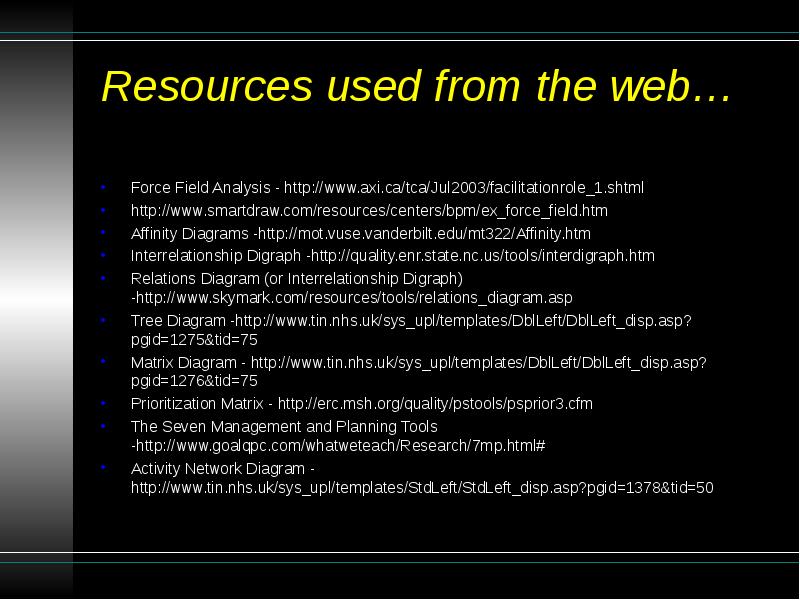
Resources used from the web…
Force Field Analysis - http://www.axi.ca/tca/Jul2003/facilitationrole_1.shtml
http://www.smartdraw.com/resources/centers/bpm/ex_force_field.htm
Affinity Diagrams -http://mot.vuse.vanderbilt.edu/mt322/Affinity.htm
Interrelationship Digraph -http://quality.enr.state.nc.us/tools/interdigraph.htm
Relations Diagram (or Interrelationship Digraph) -http://www.skymark.com/resources/tools/relations_diagram.asp
Tree Diagram -http://www.tin.nhs.uk/sys_upl/templates/DblLeft/DblLeft_disp.asp?pgid=1275&tid=75
Matrix Diagram - http://www.tin.nhs.uk/sys_upl/templates/DblLeft/DblLeft_disp.asp?pgid=1276&tid=75
Prioritization Matrix - http://erc.msh.org/quality/pstools/psprior3.cfm
The Seven Management and Planning Tools  -http://www.goalqpc.com/whatweteach/Research/7mp.html#
Activity Network Diagram - http://www.tin.nhs.uk/sys_upl/templates/StdLeft/StdLeft_disp.asp?pgid=1378&tid=50
Описание слайда:
Resources used from the web… Force Field Analysis - http://www.axi.ca/tca/Jul2003/facilitationrole_1.shtml http://www.smartdraw.com/resources/centers/bpm/ex_force_field.htm Affinity Diagrams -http://mot.vuse.vanderbilt.edu/mt322/Affinity.htm Interrelationship Digraph -http://quality.enr.state.nc.us/tools/interdigraph.htm Relations Diagram (or Interrelationship Digraph) -http://www.skymark.com/resources/tools/relations_diagram.asp Tree Diagram -http://www.tin.nhs.uk/sys_upl/templates/DblLeft/DblLeft_disp.asp?pgid=1275&tid=75 Matrix Diagram - http://www.tin.nhs.uk/sys_upl/templates/DblLeft/DblLeft_disp.asp?pgid=1276&tid=75 Prioritization Matrix - http://erc.msh.org/quality/pstools/psprior3.cfm The Seven Management and Planning Tools -http://www.goalqpc.com/whatweteach/Research/7mp.html# Activity Network Diagram - http://www.tin.nhs.uk/sys_upl/templates/StdLeft/StdLeft_disp.asp?pgid=1378&tid=50


Похожие презентации
Mypresentation.ru
Загрузить презентацию