🗊Презентация The measurement and structure of the national economy. (Chapter 2)

Нажмите для полного просмотра!
The measurement and structure of the national economy. (Chapter 2), слайд №1The measurement and structure of the national economy. (Chapter 2), слайд №2The measurement and structure of the national economy. (Chapter 2), слайд №3The measurement and structure of the national economy. (Chapter 2), слайд №4The measurement and structure of the national economy. (Chapter 2), слайд №5The measurement and structure of the national economy. (Chapter 2), слайд №6The measurement and structure of the national economy. (Chapter 2), слайд №7The measurement and structure of the national economy. (Chapter 2), слайд №8The measurement and structure of the national economy. (Chapter 2), слайд №9The measurement and structure of the national economy. (Chapter 2), слайд №10The measurement and structure of the national economy. (Chapter 2), слайд №11The measurement and structure of the national economy. (Chapter 2), слайд №12The measurement and structure of the national economy. (Chapter 2), слайд №13The measurement and structure of the national economy. (Chapter 2), слайд №14The measurement and structure of the national economy. (Chapter 2), слайд №15The measurement and structure of the national economy. (Chapter 2), слайд №16The measurement and structure of the national economy. (Chapter 2), слайд №17The measurement and structure of the national economy. (Chapter 2), слайд №18The measurement and structure of the national economy. (Chapter 2), слайд №19The measurement and structure of the national economy. (Chapter 2), слайд №20The measurement and structure of the national economy. (Chapter 2), слайд №21The measurement and structure of the national economy. (Chapter 2), слайд №22The measurement and structure of the national economy. (Chapter 2), слайд №23The measurement and structure of the national economy. (Chapter 2), слайд №24The measurement and structure of the national economy. (Chapter 2), слайд №25The measurement and structure of the national economy. (Chapter 2), слайд №26The measurement and structure of the national economy. (Chapter 2), слайд №27The measurement and structure of the national economy. (Chapter 2), слайд №28The measurement and structure of the national economy. (Chapter 2), слайд №29The measurement and structure of the national economy. (Chapter 2), слайд №30The measurement and structure of the national economy. (Chapter 2), слайд №31The measurement and structure of the national economy. (Chapter 2), слайд №32The measurement and structure of the national economy. (Chapter 2), слайд №33The measurement and structure of the national economy. (Chapter 2), слайд №34The measurement and structure of the national economy. (Chapter 2), слайд №35The measurement and structure of the national economy. (Chapter 2), слайд №36The measurement and structure of the national economy. (Chapter 2), слайд №37The measurement and structure of the national economy. (Chapter 2), слайд №38The measurement and structure of the national economy. (Chapter 2), слайд №39The measurement and structure of the national economy. (Chapter 2), слайд №40The measurement and structure of the national economy. (Chapter 2), слайд №41The measurement and structure of the national economy. (Chapter 2), слайд №42The measurement and structure of the national economy. (Chapter 2), слайд №43The measurement and structure of the national economy. (Chapter 2), слайд №44The measurement and structure of the national economy. (Chapter 2), слайд №45The measurement and structure of the national economy. (Chapter 2), слайд №46The measurement and structure of the national economy. (Chapter 2), слайд №47The measurement and structure of the national economy. (Chapter 2), слайд №48The measurement and structure of the national economy. (Chapter 2), слайд №49The measurement and structure of the national economy. (Chapter 2), слайд №50The measurement and structure of the national economy. (Chapter 2), слайд №51The measurement and structure of the national economy. (Chapter 2), слайд №52The measurement and structure of the national economy. (Chapter 2), слайд №53The measurement and structure of the national economy. (Chapter 2), слайд №54The measurement and structure of the national economy. (Chapter 2), слайд №55

Содержание
Вы можете ознакомиться и скачать презентацию на тему The measurement and structure of the national economy. (Chapter 2). Доклад-сообщение содержит 55 слайдов. Презентации для любого класса можно скачать бесплатно. Если материал и наш сайт презентаций Mypresentation Вам понравились – поделитесь им с друзьями с помощью социальных кнопок и добавьте в закладки в своем браузере.
Слайды и текст этой презентации


Слайд 1


The Measurement and Structure of the National Economy
Описание слайда:
The Measurement and Structure of the National Economy

Слайд 2


Chapter Outline
National Income Accounting: The Measurement of Production, Income, and Expenditure
Gross Domestic Product
Saving and Wealth
Real GDP, Price Indexes, and Inflation
Interest Rates
Описание слайда:
Chapter Outline National Income Accounting: The Measurement of Production, Income, and Expenditure Gross Domestic Product Saving and Wealth Real GDP, Price Indexes, and Inflation Interest Rates

Слайд 3


National Income Accounting
National income accounts: an accounting framework used in measuring current economic activity
Three alternative approaches give the same measurements
Product approach: the amount of output produced
Income approach: the incomes generated by production
Expenditure approach: the amount of spending by purchasers
Описание слайда:
National Income Accounting National income accounts: an accounting framework used in measuring current economic activity Three alternative approaches give the same measurements Product approach: the amount of output produced Income approach: the incomes generated by production Expenditure approach: the amount of spending by purchasers

Слайд 4


National Income Accounting
The national income accounts is an accounting framework used in measuring current economic activity.
The product approach measures the amount of output produced, excluding output used up in intermediate stages of production.
Описание слайда:
National Income Accounting The national income accounts is an accounting framework used in measuring current economic activity. The product approach measures the amount of output produced, excluding output used up in intermediate stages of production.

Слайд 5


National Income Accounting (continued)
The income approach measures the incomes received by the producers of output.
The expenditure approach measures the amount of spending by the ultimate purchasers of output.
Описание слайда:
National Income Accounting (continued) The income approach measures the incomes received by the producers of output. The expenditure approach measures the amount of spending by the ultimate purchasers of output.

Слайд 6


National Income Accounting
Juice business example shows that all three approaches are equal
Important concept in product approach: 
	value added = value of output minus value of inputs purchased from other producers
Описание слайда:
National Income Accounting Juice business example shows that all three approaches are equal Important concept in product approach: value added = value of output minus value of inputs purchased from other producers

Слайд 7


National Income Accounting
Why are the three approaches equivalent?
They must be, by definition
Any output produced (product approach) is purchased by someone (expenditure approach) and results in income to someone (income approach)
The fundamental identity of national income accounting:
total production = total income 
	= total expenditure				     (2.1)
Описание слайда:
National Income Accounting Why are the three approaches equivalent? They must be, by definition Any output produced (product approach) is purchased by someone (expenditure approach) and results in income to someone (income approach) The fundamental identity of national income accounting: total production = total income = total expenditure (2.1)

Слайд 8


Gross Domestic Product
The product approach to measuring GDP
GDP (gross domestic product) is the market value of final goods and services newly produced within a nation during a fixed period of time
Описание слайда:
Gross Domestic Product The product approach to measuring GDP GDP (gross domestic product) is the market value of final goods and services newly produced within a nation during a fixed period of time

Слайд 9


Gross Domestic Product
Market value: allows adding together unlike items by valuing them at their market prices
Problem: misses nonmarket items such as homemaking, the value of environmental quality, and natural resource depletion 
There is some adjustment to reflect the underground economy
Government services (that aren’t sold in markets) are valued at their cost of production
Описание слайда:
Gross Domestic Product Market value: allows adding together unlike items by valuing them at their market prices Problem: misses nonmarket items such as homemaking, the value of environmental quality, and natural resource depletion There is some adjustment to reflect the underground economy Government services (that aren’t sold in markets) are valued at their cost of production

Слайд 10


Gross Domestic Product
Newly produced: counts only things produced in the given period; excludes things produced earlier
Описание слайда:
Gross Domestic Product Newly produced: counts only things produced in the given period; excludes things produced earlier

Слайд 11


Gross Domestic Product
Final goods and services
Don’t count intermediate goods and services (those used up in the production of other goods and services in the same period that they themselves were produced)
Final goods & services are those that are not intermediate
Capital goods (goods used to produce other goods) are final goods since they aren’t used up in the same period that they are produced
Описание слайда:
Gross Domestic Product Final goods and services Don’t count intermediate goods and services (those used up in the production of other goods and services in the same period that they themselves were produced) Final goods & services are those that are not intermediate Capital goods (goods used to produce other goods) are final goods since they aren’t used up in the same period that they are produced

Слайд 12


Gross Domestic Product
Final goods and services
Inventory investment (the amount that inventories of unsold finished goods, goods in process, and raw materials have changed during the period) is also treated as a final good
Adding up value added works well, since it automatically excludes intermediate goods
Описание слайда:
Gross Domestic Product Final goods and services Inventory investment (the amount that inventories of unsold finished goods, goods in process, and raw materials have changed during the period) is also treated as a final good Adding up value added works well, since it automatically excludes intermediate goods

Слайд 13


Gross Domestic Product
GNP vs. GDP
GNP (gross national product) = output produced by domestically owned factors of production
GDP = output produced within a nation
GDP = GNP – NFP 		      (2.2)
NFP = net factor payments from abroad	
	= payments to domestically owned factors located abroad minus payments to foreign factors located domestically
Описание слайда:
Gross Domestic Product GNP vs. GDP GNP (gross national product) = output produced by domestically owned factors of production GDP = output produced within a nation GDP = GNP – NFP (2.2) NFP = net factor payments from abroad = payments to domestically owned factors located abroad minus payments to foreign factors located domestically

Слайд 14


Gross Domestic Product
GNP vs. GDP
Example: Engineering revenues for a road built by a U.S. company in Saudi Arabia is part of U.S. GNP (built by a U.S. factor of production), not U.S. GDP, and is part of Saudi GDP (built in Saudi Arabia), not Saudi GNP
Difference between GNP and GDP is small for the United States, about 0.2%, but higher for countries that have many citizens working abroad
Описание слайда:
Gross Domestic Product GNP vs. GDP Example: Engineering revenues for a road built by a U.S. company in Saudi Arabia is part of U.S. GNP (built by a U.S. factor of production), not U.S. GDP, and is part of Saudi GDP (built in Saudi Arabia), not Saudi GNP Difference between GNP and GDP is small for the United States, about 0.2%, but higher for countries that have many citizens working abroad

Слайд 15


Gross Domestic Product
The expenditure approach to measuring GDP
Measures total spending on final goods and services produced within a nation during a specified period of time
Four main categories of spending: consumption (C), investment (I), government purchases of goods and services (G), and net exports (NX)
Y = C + I + G + NX 				      (2.3)
the income-expenditure identity
Описание слайда:
Gross Domestic Product The expenditure approach to measuring GDP Measures total spending on final goods and services produced within a nation during a specified period of time Four main categories of spending: consumption (C), investment (I), government purchases of goods and services (G), and net exports (NX) Y = C + I + G + NX (2.3) the income-expenditure identity

Слайд 16


Gross Domestic Product
The expenditure approach to measuring GDP
Consumption: spending by domestic households on final goods and services (including those produced abroad)
About 2/3 of U.S. GDP
Three categories
Consumer durables (examples: cars, TV sets, furniture, major appliances)
Nondurable goods (examples: food, clothing, fuel)
Services (examples: education, health care, financial services, transportation)
Описание слайда:
Gross Domestic Product The expenditure approach to measuring GDP Consumption: spending by domestic households on final goods and services (including those produced abroad) About 2/3 of U.S. GDP Three categories Consumer durables (examples: cars, TV sets, furniture, major appliances) Nondurable goods (examples: food, clothing, fuel) Services (examples: education, health care, financial services, transportation)

Слайд 17


Gross Domestic Product
The expenditure approach to measuring GDP
Investment: spending for new capital goods (fixed investment) plus inventory investment
About 1/6 of U.S. GDP
Business (or nonresidential) fixed investment: spending by businesses on structures and equipment and software
Residential fixed investment: spending on the construction of houses and apartment buildings
Inventory investment: increases in firms’ inventory holdings
Описание слайда:
Gross Domestic Product The expenditure approach to measuring GDP Investment: spending for new capital goods (fixed investment) plus inventory investment About 1/6 of U.S. GDP Business (or nonresidential) fixed investment: spending by businesses on structures and equipment and software Residential fixed investment: spending on the construction of houses and apartment buildings Inventory investment: increases in firms’ inventory holdings

Слайд 18


Gross Domestic Product
The expenditure approach to measuring GDP
Government purchases of goods and services: spending by the government on goods or services
About 1/5 of U.S. GDP
Most by state and local governments, not federal government
Not all government expenditures are purchases of goods and services
Some are payments that are not made in exchange for current goods and services
One type is transfers, including Social Security payments, welfare, and unemployment benefits
Another type is interest payments on the government debt
Some government spending is for capital goods that add to the nation’s capital stock, such as highways, airports, bridges, and water and sewer systems
Описание слайда:
Gross Domestic Product The expenditure approach to measuring GDP Government purchases of goods and services: spending by the government on goods or services About 1/5 of U.S. GDP Most by state and local governments, not federal government Not all government expenditures are purchases of goods and services Some are payments that are not made in exchange for current goods and services One type is transfers, including Social Security payments, welfare, and unemployment benefits Another type is interest payments on the government debt Some government spending is for capital goods that add to the nation’s capital stock, such as highways, airports, bridges, and water and sewer systems

Слайд 19


Gross Domestic Product
The expenditure approach to measuring GDP
Net exports: exports minus imports
Exports: goods produced in the country that are purchased by foreigners
Imports: goods produced abroad that are purchased by residents in the country
Imports are subtracted from GDP, as they represent goods produced abroad, and were included in consumption, investment, and government purchases
Описание слайда:
Gross Domestic Product The expenditure approach to measuring GDP Net exports: exports minus imports Exports: goods produced in the country that are purchased by foreigners Imports: goods produced abroad that are purchased by residents in the country Imports are subtracted from GDP, as they represent goods produced abroad, and were included in consumption, investment, and government purchases

Слайд 20


The measurement and structure of the national economy. (Chapter 2), слайд №20
Описание слайда:

Слайд 21


Gross Domestic Product
The income approach to measuring GDP
Adds up income generated by production (including profits and taxes paid to the government)
National income = compensation of employees (including benefits) + proprietors’ income + rental income of persons + corporate profits + net interest + taxes on production and imports + business current transfer payments + current surplus of government enterprises
National income + statistical discrepancy = net national product
Net national product + depreciation (the value of capital that wears out in the period) = gross national product (GNP)
GNP – net factor payments (NFP) = GDP
Описание слайда:
Gross Domestic Product The income approach to measuring GDP Adds up income generated by production (including profits and taxes paid to the government) National income = compensation of employees (including benefits) + proprietors’ income + rental income of persons + corporate profits + net interest + taxes on production and imports + business current transfer payments + current surplus of government enterprises National income + statistical discrepancy = net national product Net national product + depreciation (the value of capital that wears out in the period) = gross national product (GNP) GNP – net factor payments (NFP) = GDP

Слайд 22


Gross Domestic Product
The income approach to measuring GDP
Private sector and government sector income
Private disposable income = income of the private sector = private sector income earned at home (Y or GDP) and abroad (NFP) + payments from the government sector (transfers, TR, and interest on government debt, INT) – taxes paid to government (T) = Y + NFP + TR + INT – T         (2.4)
Government’s net income = taxes – transfers – interest payments = T – TR – INT  			              (2.5)
Private disposable income + government’s net income = GDP + NFP = GNP
Описание слайда:
Gross Domestic Product The income approach to measuring GDP Private sector and government sector income Private disposable income = income of the private sector = private sector income earned at home (Y or GDP) and abroad (NFP) + payments from the government sector (transfers, TR, and interest on government debt, INT) – taxes paid to government (T) = Y + NFP + TR + INT – T (2.4) Government’s net income = taxes – transfers – interest payments = T – TR – INT (2.5) Private disposable income + government’s net income = GDP + NFP = GNP

Слайд 23


The measurement and structure of the national economy. (Chapter 2), слайд №23
Описание слайда:

Слайд 24


Saving and Wealth
Wealth 
Household wealth = a household’s assets minus its liabilities
National wealth = sum of all households’, firms’, and governments’ wealth within the nation
Saving by individuals, businesses, and government determine wealth
Описание слайда:
Saving and Wealth Wealth Household wealth = a household’s assets minus its liabilities National wealth = sum of all households’, firms’, and governments’ wealth within the nation Saving by individuals, businesses, and government determine wealth

Слайд 25


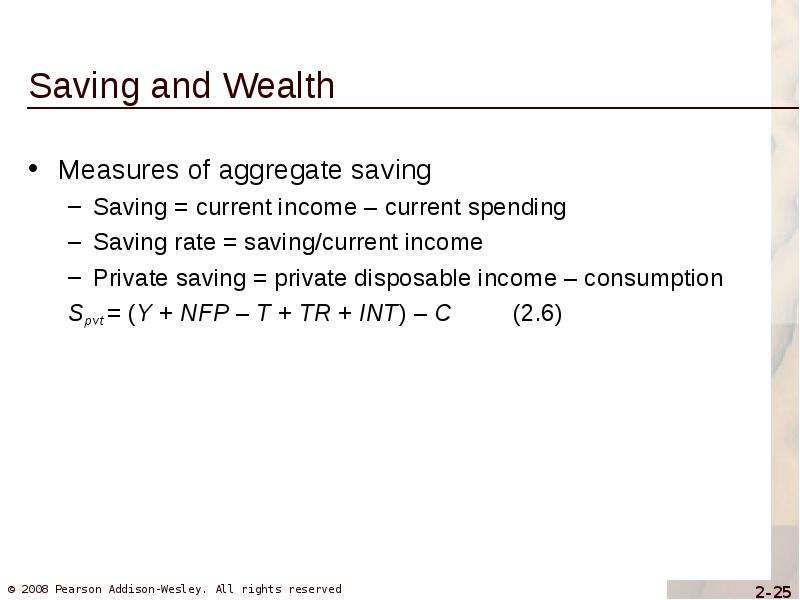
Saving and Wealth
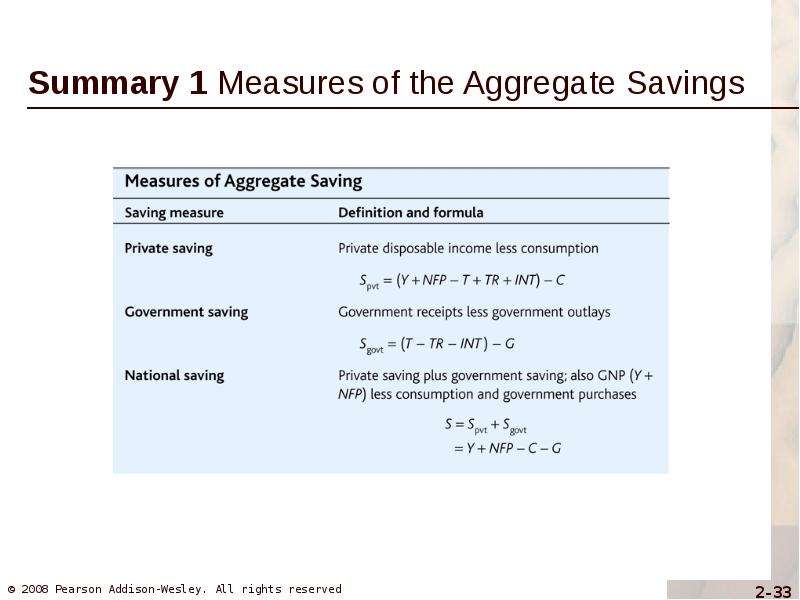
Measures of aggregate saving
Saving = current income – current spending
Saving rate = saving/current income
Private saving = private disposable income – consumption
Spvt = (Y + NFP – T + TR + INT) – C         (2.6)
Описание слайда:
Saving and Wealth Measures of aggregate saving Saving = current income – current spending Saving rate = saving/current income Private saving = private disposable income – consumption Spvt = (Y + NFP – T + TR + INT) – C (2.6)

Слайд 26


Saving and Wealth
Measures of aggregate saving
Government saving = net government income – government purchases of goods and services
	Sgovt = (T – TR – INT) – G	 			(2.7)
Government saving = government budget surplus = government receipts – government outlays
Government receipts = tax revenue (T)
Government outlays = government purchases of goods and services (G) + transfers (TR) + interest payments on government debt (INT)
Government budget deficit = – Sgovt 
Simplification: count government investment as government purchases, not investment
Описание слайда:
Saving and Wealth Measures of aggregate saving Government saving = net government income – government purchases of goods and services Sgovt = (T – TR – INT) – G (2.7) Government saving = government budget surplus = government receipts – government outlays Government receipts = tax revenue (T) Government outlays = government purchases of goods and services (G) + transfers (TR) + interest payments on government debt (INT) Government budget deficit = – Sgovt Simplification: count government investment as government purchases, not investment

Слайд 27


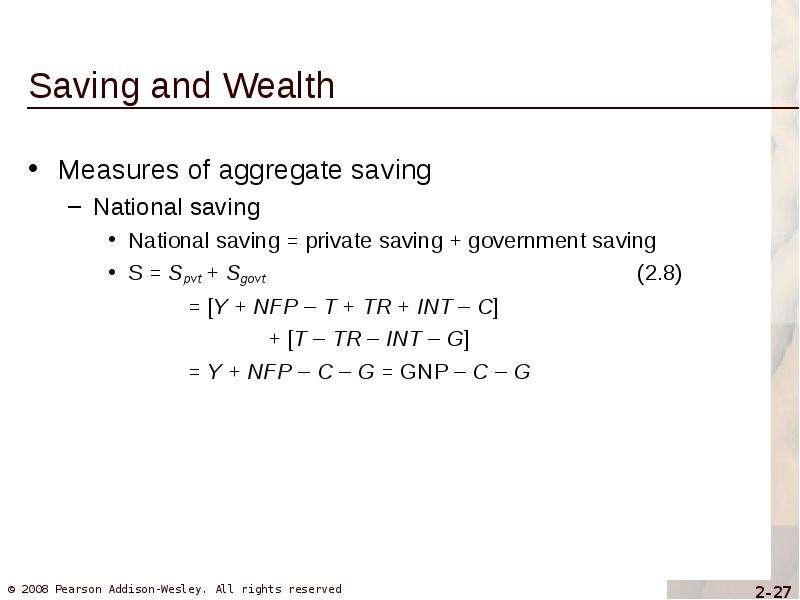
Saving and Wealth
Measures of aggregate saving
National saving
National saving = private saving + government saving
S = Spvt + Sgovt 				        (2.8)
		= [Y + NFP – T + TR + INT – C] 
			+ [T – TR – INT – G]
		= Y + NFP – C – G = GNP – C – G
Описание слайда:
Saving and Wealth Measures of aggregate saving National saving National saving = private saving + government saving S = Spvt + Sgovt (2.8) = [Y + NFP – T + TR + INT – C] + [T – TR – INT – G] = Y + NFP – C – G = GNP – C – G

Слайд 28


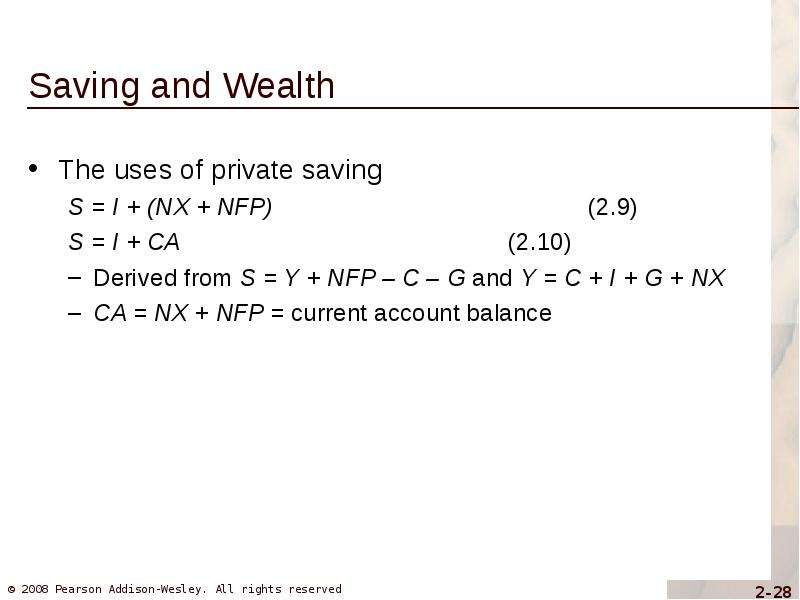
Saving and Wealth
The uses of private saving
S = I + (NX + NFP)				(2.9)
S = I + CA					(2.10)
Derived from S = Y + NFP – C – G and Y = C + I + G + NX
CA = NX + NFP = current account balance
Описание слайда:
Saving and Wealth The uses of private saving S = I + (NX + NFP) (2.9) S = I + CA (2.10) Derived from S = Y + NFP – C – G and Y = C + I + G + NX CA = NX + NFP = current account balance

Слайд 29


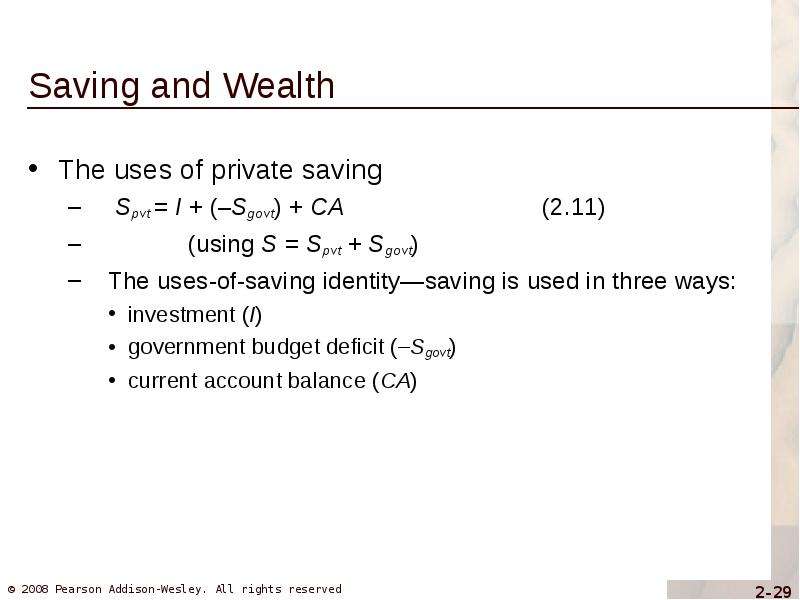
Saving and Wealth
The uses of private saving
	 Spvt = I + (–Sgovt) + CA 		     (2.11)
		(using S = Spvt + Sgovt)
	The uses-of-saving identity—saving is used in three ways:
investment (I)
government budget deficit (–Sgovt)
current account balance (CA)
Описание слайда:
Saving and Wealth The uses of private saving Spvt = I + (–Sgovt) + CA (2.11) (using S = Spvt + Sgovt) The uses-of-saving identity—saving is used in three ways: investment (I) government budget deficit (–Sgovt) current account balance (CA)

Слайд 30


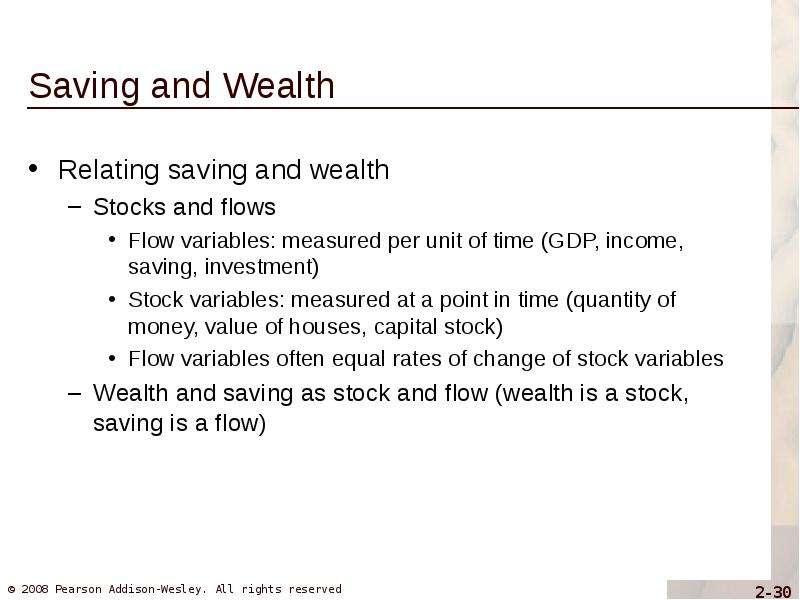
Saving and Wealth
Relating saving and wealth
Stocks and flows
Flow variables: measured per unit of time (GDP, income, saving, investment)
Stock variables: measured at a point in time (quantity of money, value of houses, capital stock)
Flow variables often equal rates of change of stock variables
Wealth and saving as stock and flow (wealth is a stock, saving is a flow)
Описание слайда:
Saving and Wealth Relating saving and wealth Stocks and flows Flow variables: measured per unit of time (GDP, income, saving, investment) Stock variables: measured at a point in time (quantity of money, value of houses, capital stock) Flow variables often equal rates of change of stock variables Wealth and saving as stock and flow (wealth is a stock, saving is a flow)

Слайд 31


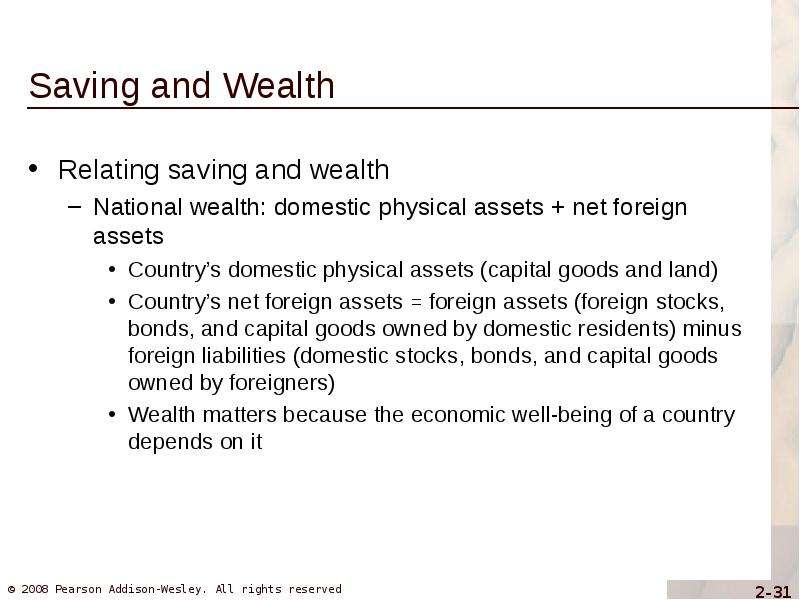
Saving and Wealth
Relating saving and wealth
National wealth: domestic physical assets + net foreign assets
Country’s domestic physical assets (capital goods and land)
Country’s net foreign assets = foreign assets (foreign stocks, bonds, and capital goods owned by domestic residents) minus foreign liabilities (domestic stocks, bonds, and capital goods owned by foreigners)
Wealth matters because the economic well-being of a country depends on it
Описание слайда:
Saving and Wealth Relating saving and wealth National wealth: domestic physical assets + net foreign assets Country’s domestic physical assets (capital goods and land) Country’s net foreign assets = foreign assets (foreign stocks, bonds, and capital goods owned by domestic residents) minus foreign liabilities (domestic stocks, bonds, and capital goods owned by foreigners) Wealth matters because the economic well-being of a country depends on it

Слайд 32


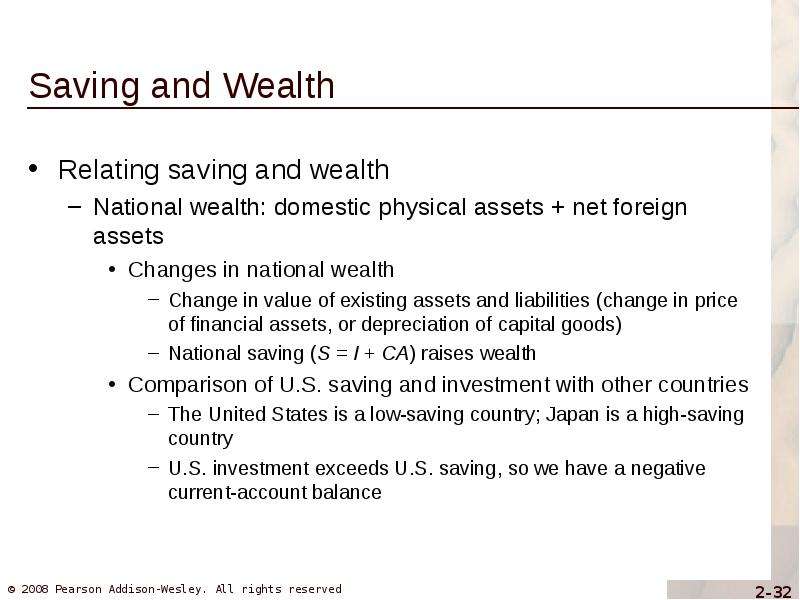
Saving and Wealth
Relating saving and wealth
National wealth: domestic physical assets + net foreign assets
Changes in national wealth
Change in value of existing assets and liabilities (change in price of financial assets, or depreciation of capital goods)
National saving (S = I + CA) raises wealth
Comparison of U.S. saving and investment with other countries
The United States is a low-saving country; Japan is a high-saving country
U.S. investment exceeds U.S. saving, so we have a negative current-account balance
Описание слайда:
Saving and Wealth Relating saving and wealth National wealth: domestic physical assets + net foreign assets Changes in national wealth Change in value of existing assets and liabilities (change in price of financial assets, or depreciation of capital goods) National saving (S = I + CA) raises wealth Comparison of U.S. saving and investment with other countries The United States is a low-saving country; Japan is a high-saving country U.S. investment exceeds U.S. saving, so we have a negative current-account balance

Слайд 33


The measurement and structure of the national economy. (Chapter 2), слайд №33
Описание слайда:

Слайд 34


Saving and Wealth
Application: Wealth Versus Saving
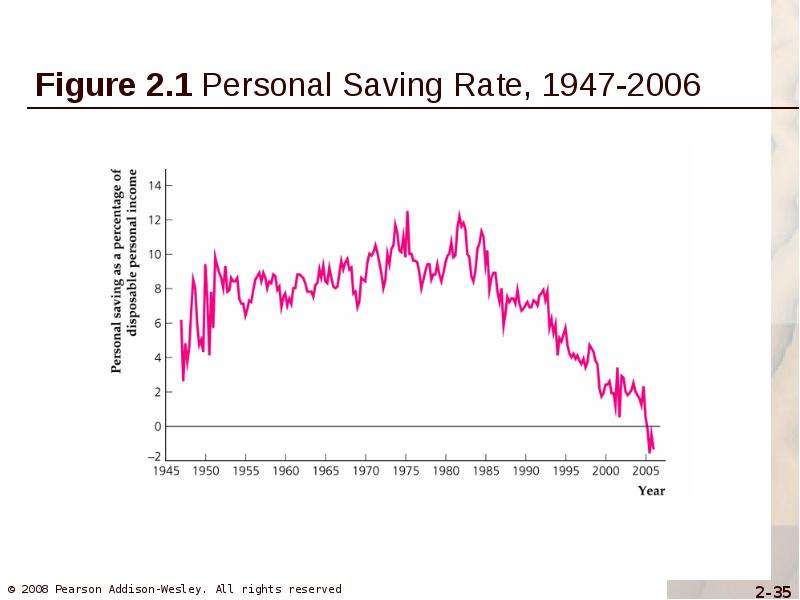
The personal saving rate has declined dramatically in recent years (Fig. 2.1)
Описание слайда:
Saving and Wealth Application: Wealth Versus Saving The personal saving rate has declined dramatically in recent years (Fig. 2.1)

Слайд 35


The measurement and structure of the national economy. (Chapter 2), слайд №35
Описание слайда:

Слайд 36


Saving and Wealth
Application: Wealth Versus Saving
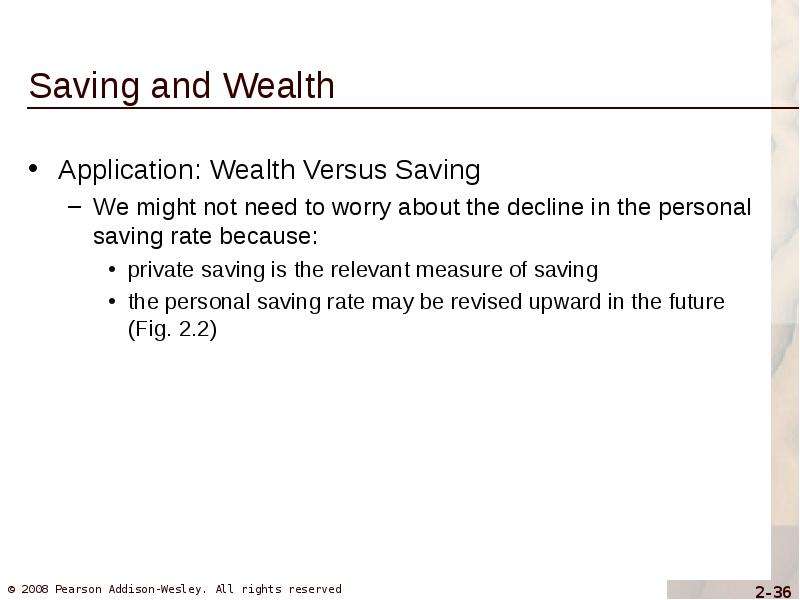
We might not need to worry about the decline in the personal saving rate because:
private saving is the relevant measure of saving
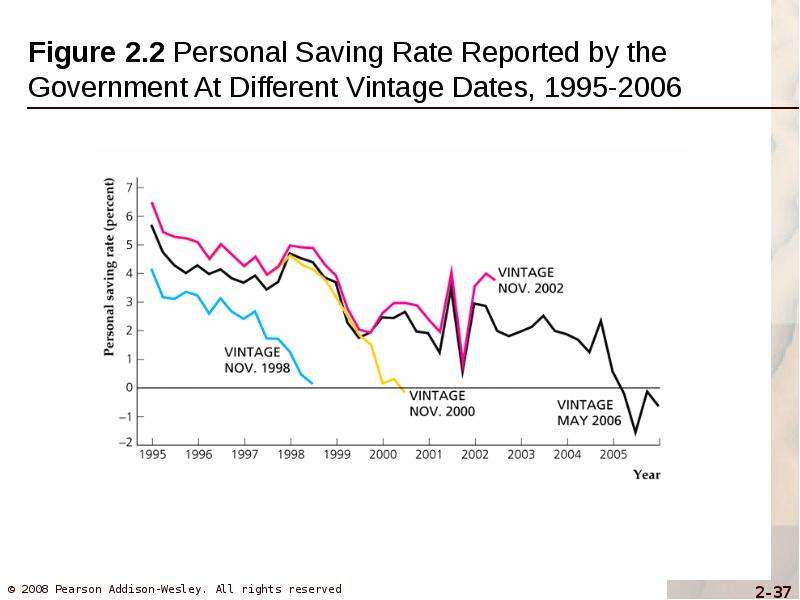
the personal saving rate may be revised upward in the future (Fig. 2.2)
Описание слайда:
Saving and Wealth Application: Wealth Versus Saving We might not need to worry about the decline in the personal saving rate because: private saving is the relevant measure of saving the personal saving rate may be revised upward in the future (Fig. 2.2)

Слайд 37


The measurement and structure of the national economy. (Chapter 2), слайд №37
Описание слайда:

Слайд 38


Saving and Wealth
Application: Wealth Versus Saving
We might not need to worry about the decline in the personal saving rate because:
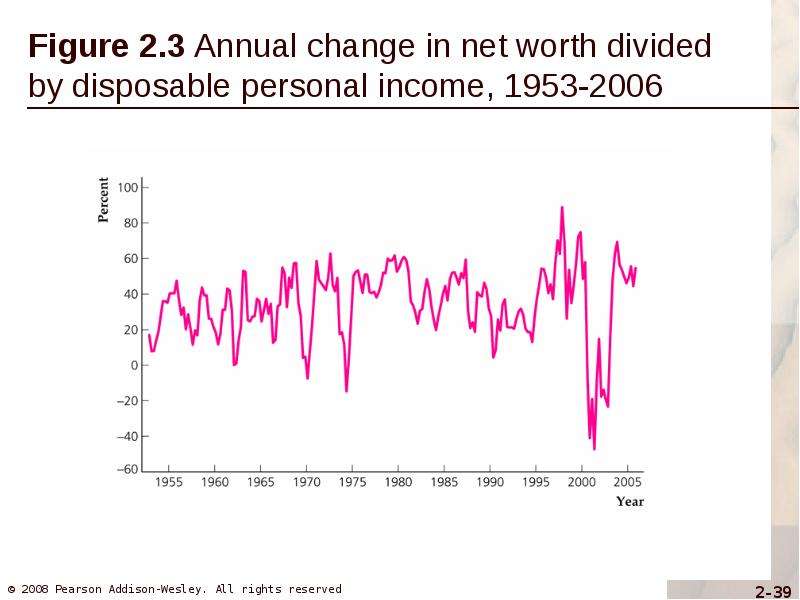
the personal saving rate ignores capital gains; as people’s wealth rises, their saving rate declines (Fig. 2.3)
Описание слайда:
Saving and Wealth Application: Wealth Versus Saving We might not need to worry about the decline in the personal saving rate because: the personal saving rate ignores capital gains; as people’s wealth rises, their saving rate declines (Fig. 2.3)

Слайд 39


Figure 2.3 Annual change in net worth divided by disposable personal income, 1953-2006
Описание слайда:
Figure 2.3 Annual change in net worth divided by disposable personal income, 1953-2006

Слайд 40


Real GDP, Price Indexes, and Inflation 
Real GDP
Nominal variables are those in dollar terms
Problem: Do changes in nominal values reflect changes in prices or quantities?
Real variables: adjust for price changes; reflect only quantity changes
Описание слайда:
Real GDP, Price Indexes, and Inflation Real GDP Nominal variables are those in dollar terms Problem: Do changes in nominal values reflect changes in prices or quantities? Real variables: adjust for price changes; reflect only quantity changes

Слайд 41


Real GDP, Price Indexes, and Inflation 
Real GDP
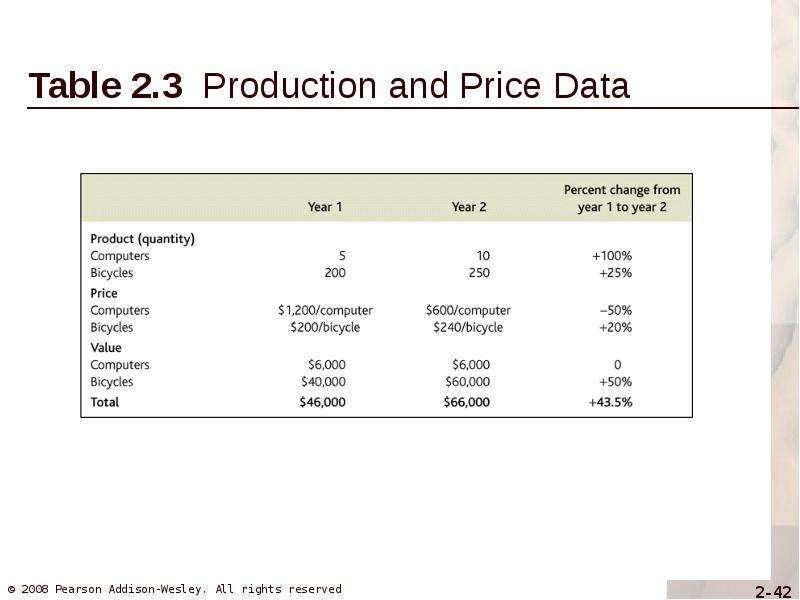
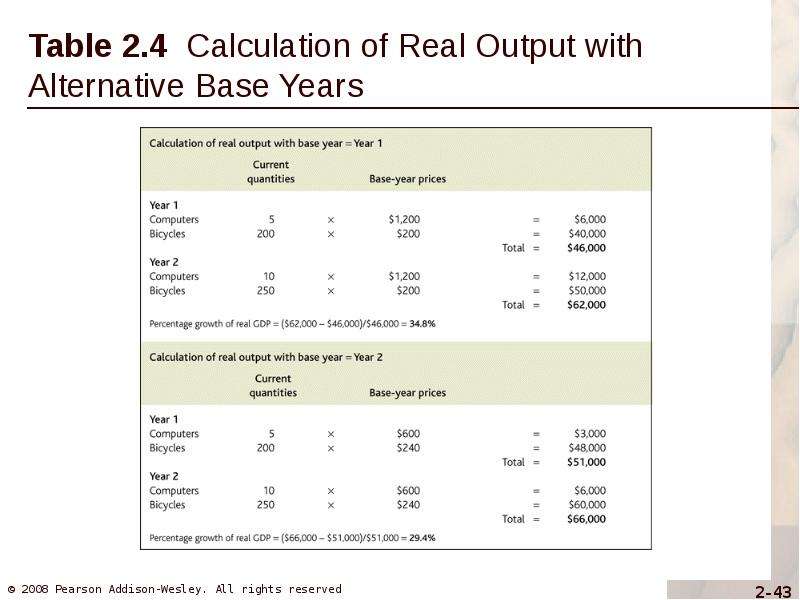
Example of computers and bicycles
Nominal GDP is the dollar value of an economy’s final output measured at current market prices
Real GDP is an estimate of the value of an economy’s final output, adjusting for changes in the overall price level
Описание слайда:
Real GDP, Price Indexes, and Inflation Real GDP Example of computers and bicycles Nominal GDP is the dollar value of an economy’s final output measured at current market prices Real GDP is an estimate of the value of an economy’s final output, adjusting for changes in the overall price level

Слайд 42


Table 2.3  Production and Price Data
Описание слайда:
Table 2.3 Production and Price Data

Слайд 43


Table 2.4  Calculation of Real Output with Alternative Base Years
Описание слайда:
Table 2.4 Calculation of Real Output with Alternative Base Years

Слайд 44


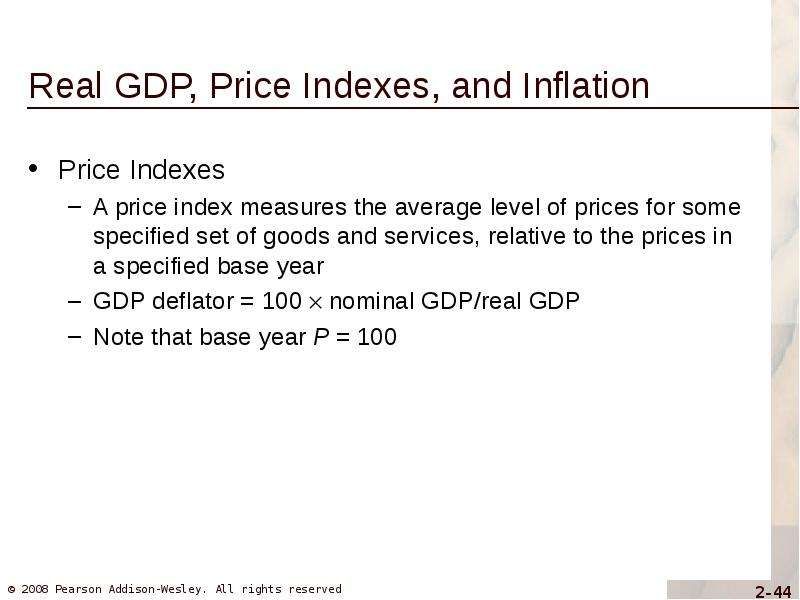
Real GDP, Price Indexes, and Inflation 
Price Indexes 
A price index measures the average level of prices for some specified set of goods and services, relative to the prices in a specified base year
GDP deflator = 100  nominal GDP/real GDP
Note that base year P = 100
Описание слайда:
Real GDP, Price Indexes, and Inflation Price Indexes A price index measures the average level of prices for some specified set of goods and services, relative to the prices in a specified base year GDP deflator = 100  nominal GDP/real GDP Note that base year P = 100

Слайд 45


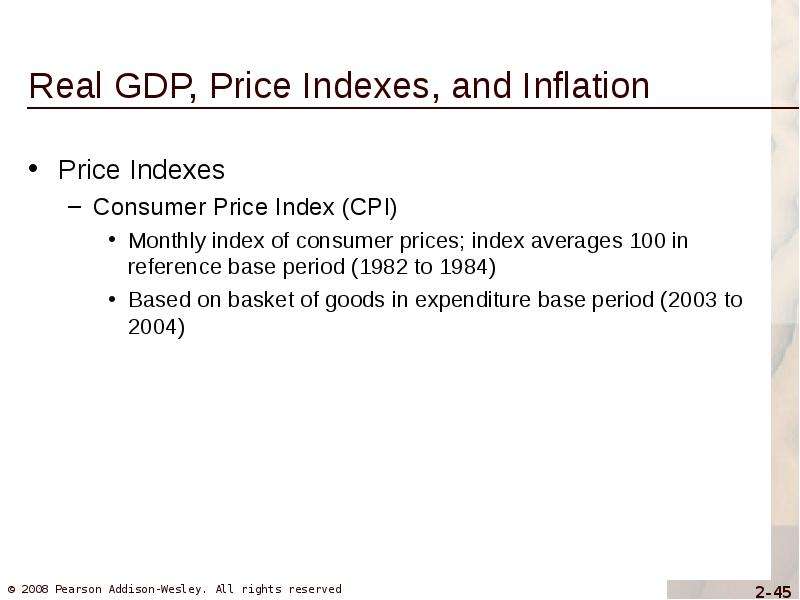
Real GDP, Price Indexes, and Inflation 
Price Indexes 
Consumer Price Index (CPI)
Monthly index of consumer prices; index averages 100 in reference base period (1982 to 1984) 
Based on basket of goods in expenditure base period (2003 to 2004)
Описание слайда:
Real GDP, Price Indexes, and Inflation Price Indexes Consumer Price Index (CPI) Monthly index of consumer prices; index averages 100 in reference base period (1982 to 1984) Based on basket of goods in expenditure base period (2003 to 2004)

Слайд 46


Real GDP, Price Indexes, and Inflation 
Price Indexes 
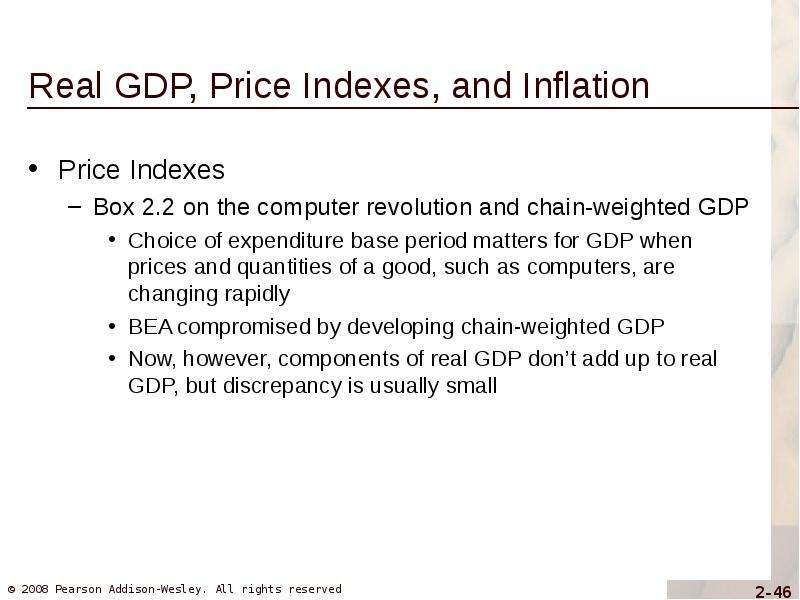
Box 2.2 on the computer revolution and chain-weighted GDP
Choice of expenditure base period matters for GDP when prices and quantities of a good, such as computers, are changing rapidly
BEA compromised by developing chain-weighted GDP
Now, however, components of real GDP don’t add up to real GDP, but discrepancy is usually small
Описание слайда:
Real GDP, Price Indexes, and Inflation Price Indexes Box 2.2 on the computer revolution and chain-weighted GDP Choice of expenditure base period matters for GDP when prices and quantities of a good, such as computers, are changing rapidly BEA compromised by developing chain-weighted GDP Now, however, components of real GDP don’t add up to real GDP, but discrepancy is usually small

Слайд 47


Real GDP, Price Indexes, and Inflation 
Price Indexes 
Inflation
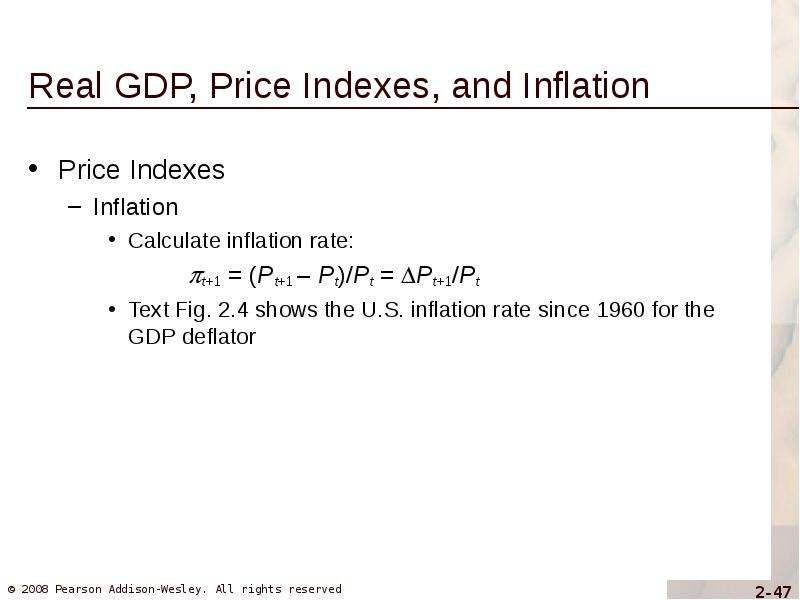
Calculate inflation rate: 
			t+1 = (Pt+1 – Pt)/Pt = Pt+1/Pt
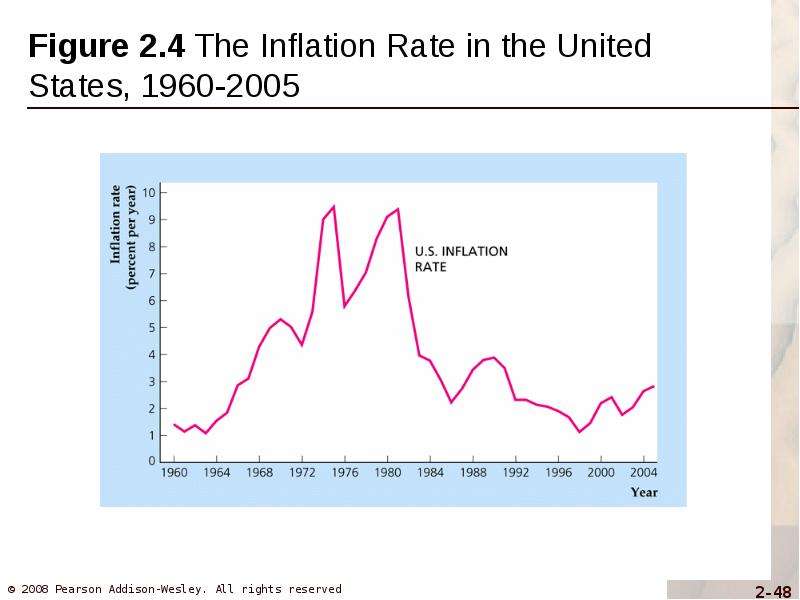
Text Fig. 2.4 shows the U.S. inflation rate since 1960 for the GDP deflator
Описание слайда:
Real GDP, Price Indexes, and Inflation Price Indexes Inflation Calculate inflation rate: t+1 = (Pt+1 – Pt)/Pt = Pt+1/Pt Text Fig. 2.4 shows the U.S. inflation rate since 1960 for the GDP deflator

Слайд 48


The measurement and structure of the national economy. (Chapter 2), слайд №48
Описание слайда:

Слайд 49


Real GDP, Price Indexes, and Inflation 
Price Indexes 
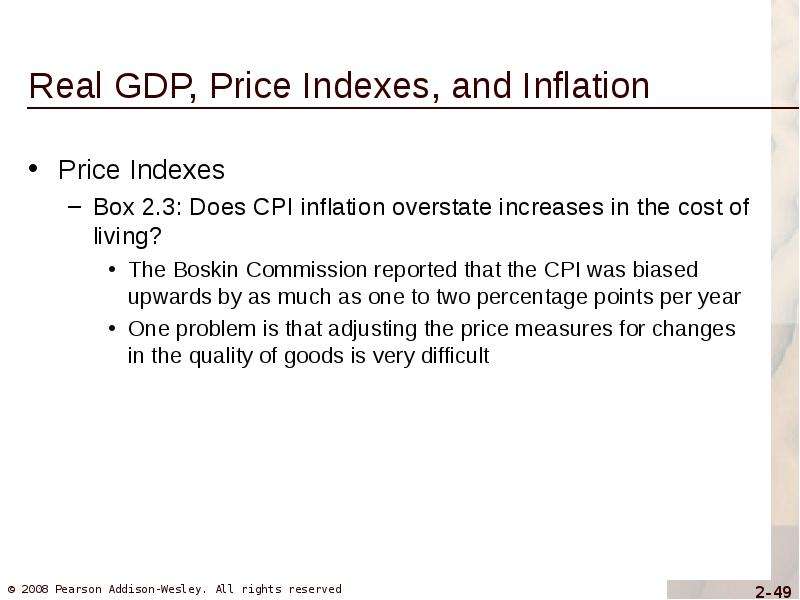
Box 2.3: Does CPI inflation overstate increases in the cost of living?
The Boskin Commission reported that the CPI was biased upwards by as much as one to two percentage points per year
One problem is that adjusting the price measures for changes in the quality of goods is very difficult
Описание слайда:
Real GDP, Price Indexes, and Inflation Price Indexes Box 2.3: Does CPI inflation overstate increases in the cost of living? The Boskin Commission reported that the CPI was biased upwards by as much as one to two percentage points per year One problem is that adjusting the price measures for changes in the quality of goods is very difficult

Слайд 50


Real GDP, Price Indexes, and Inflation 
Price Indexes 
Box 2.3: Does CPI inflation overstate increases in the cost of living?
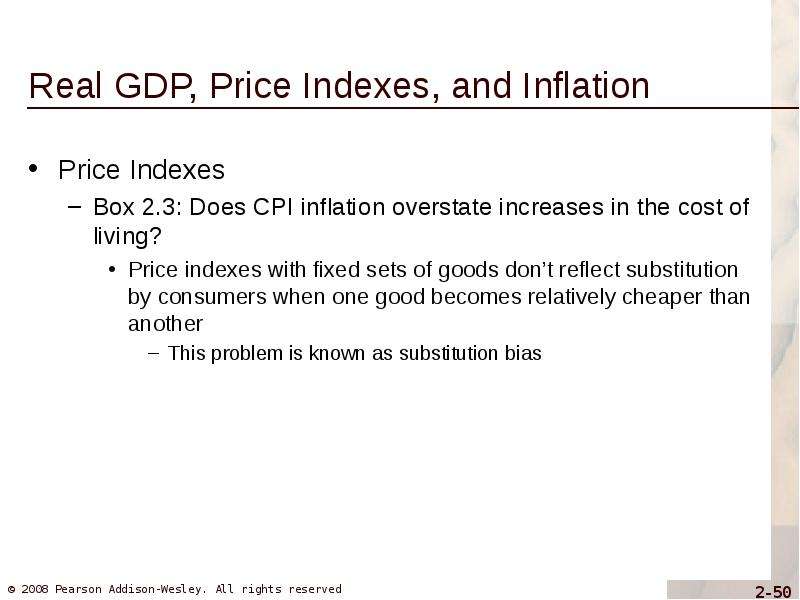
Price indexes with fixed sets of goods don’t reflect substitution by consumers when one good becomes relatively cheaper than another
This problem is known as substitution bias
Описание слайда:
Real GDP, Price Indexes, and Inflation Price Indexes Box 2.3: Does CPI inflation overstate increases in the cost of living? Price indexes with fixed sets of goods don’t reflect substitution by consumers when one good becomes relatively cheaper than another This problem is known as substitution bias

Слайд 51


Real GDP, Price Indexes, and Inflation 
Price Indexes 
Box 2.3: Does CPI inflation overstate increases in the cost of living?
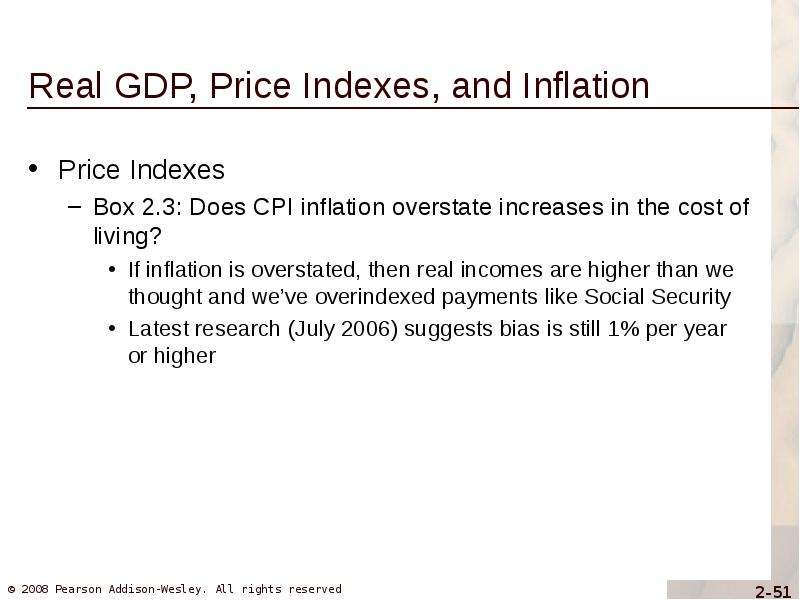
If inflation is overstated, then real incomes are higher than we thought and we’ve overindexed payments like Social Security
Latest research (July 2006) suggests bias is still 1% per year or higher
Описание слайда:
Real GDP, Price Indexes, and Inflation Price Indexes Box 2.3: Does CPI inflation overstate increases in the cost of living? If inflation is overstated, then real incomes are higher than we thought and we’ve overindexed payments like Social Security Latest research (July 2006) suggests bias is still 1% per year or higher

Слайд 52


Interest Rates 
Real vs. nominal interest rates
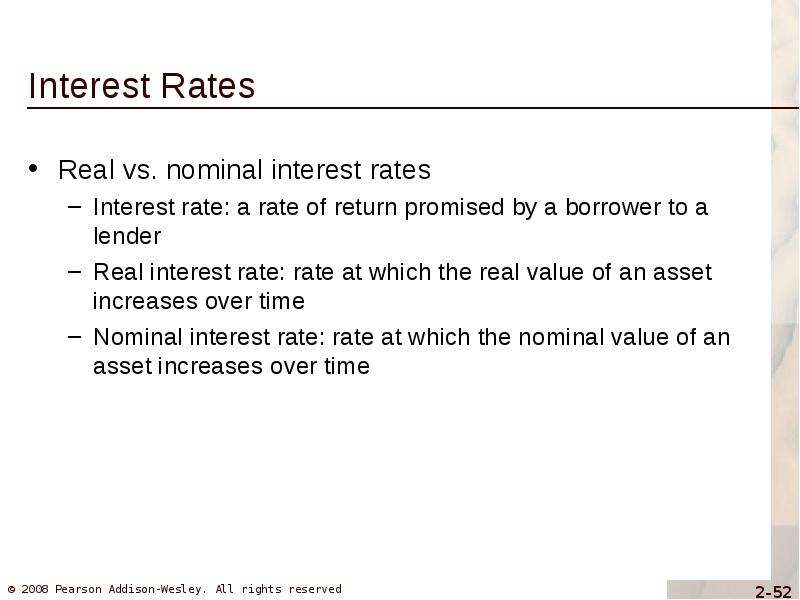
Interest rate: a rate of return promised by a borrower to a lender
Real interest rate: rate at which the real value of an asset increases over time
Nominal interest rate: rate at which the nominal value of an asset increases over time
Описание слайда:
Interest Rates Real vs. nominal interest rates Interest rate: a rate of return promised by a borrower to a lender Real interest rate: rate at which the real value of an asset increases over time Nominal interest rate: rate at which the nominal value of an asset increases over time

Слайд 53


Interest Rates 
Real vs. nominal interest rates
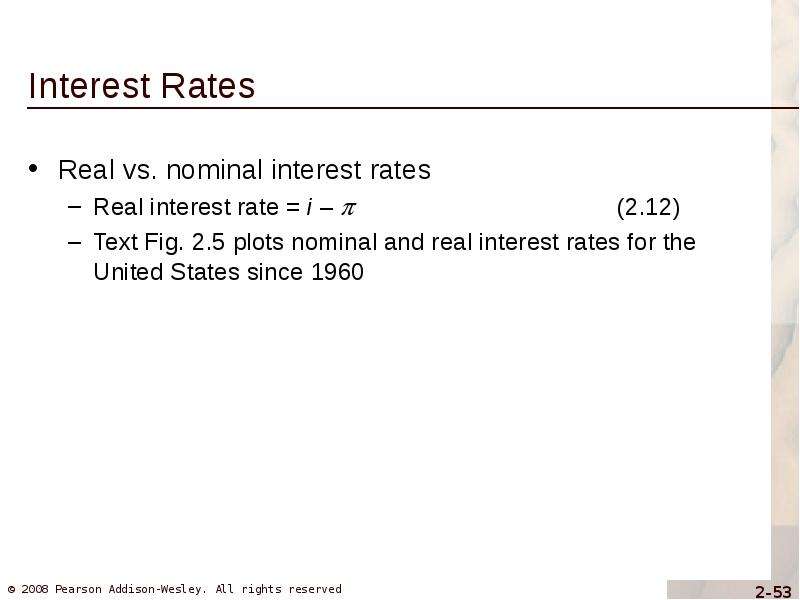
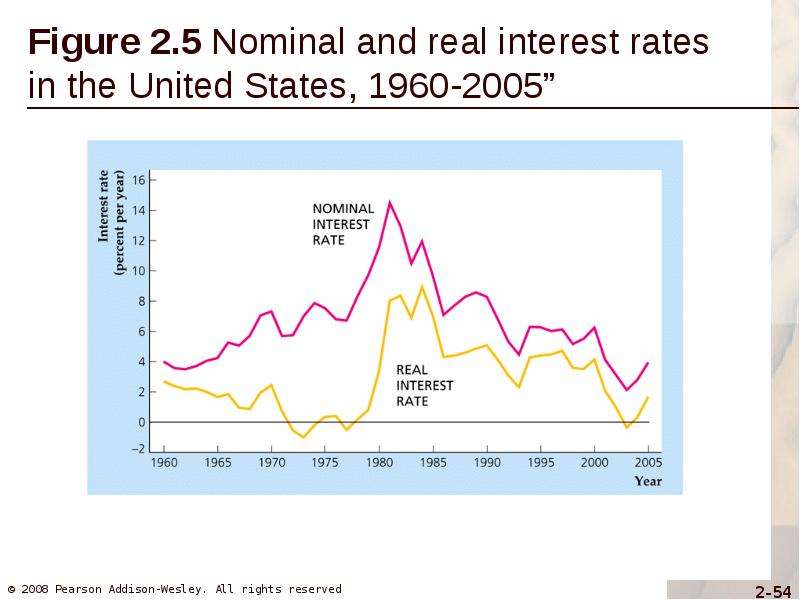
Real interest rate = i – 		                (2.12)
Text Fig. 2.5 plots nominal and real interest rates for the United States since 1960
Описание слайда:
Interest Rates Real vs. nominal interest rates Real interest rate = i –  (2.12) Text Fig. 2.5 plots nominal and real interest rates for the United States since 1960

Слайд 54


The measurement and structure of the national economy. (Chapter 2), слайд №54
Описание слайда:

Слайд 55


Interest Rates 
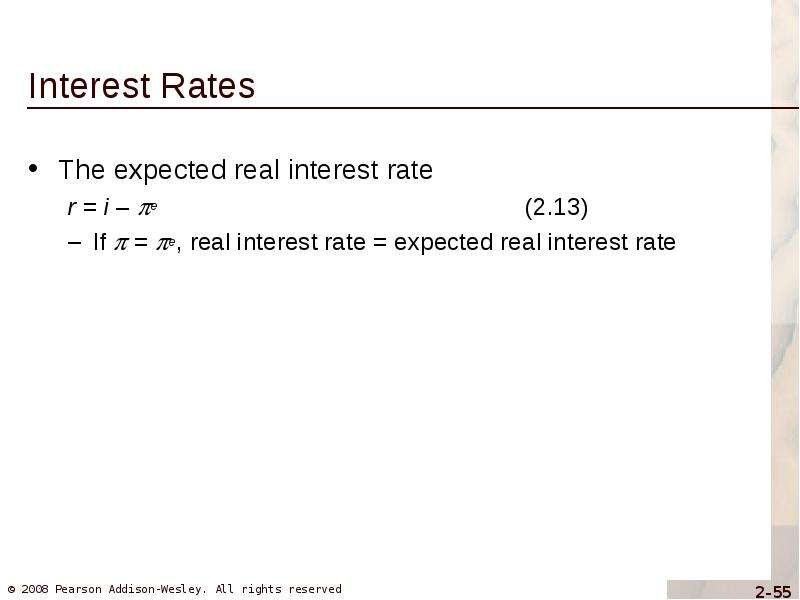
The expected real interest rate
r = i – e			                          (2.13)
If  = e, real interest rate = expected real interest rate
Описание слайда:
Interest Rates The expected real interest rate r = i – e (2.13) If  = e, real interest rate = expected real interest rate


Похожие презентации
Mypresentation.ru
Загрузить презентацию