Описание слайда:
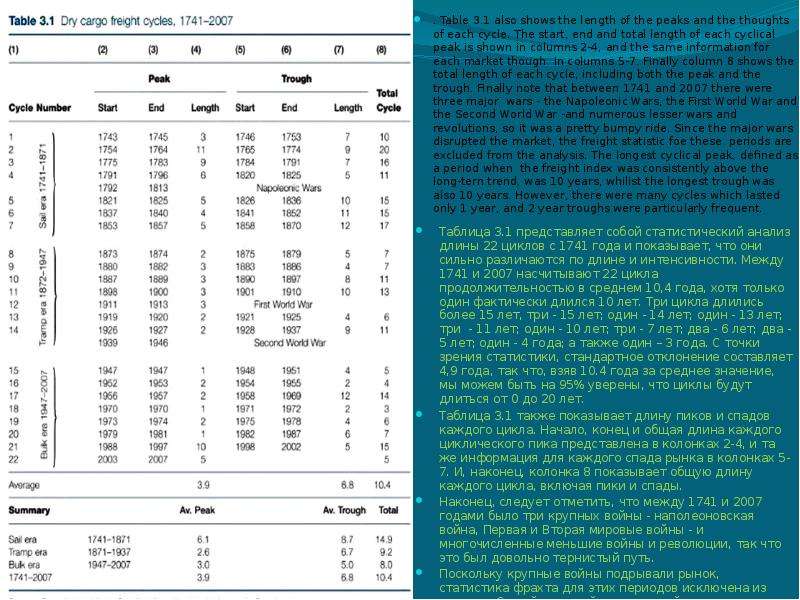
Таблица 3.1 представляет собой статистический анализ длины 22 циклов с 1741 года и показывает, что они сильно различаются по длине и интенсивности. Между 1741 и 2007 насчитывают 22 цикла продолжительностью в среднем 10,4 года, хотя только один фактически длился 10 лет. Три цикла длились более 15 лет, три - 15 лет; один - 14 лет; один - 13 лет; три - 11 лет; один - 10 лет; три - 7 лет; два - 6 лет; два - 5 лет; один - 4 года; а также один – 3 года. С точки зрения статистики, стандартное отклонение составляет 4,9 года, так что, взяв 10.4 года за среднее значение, мы можем быть на 95% уверены, что циклы будут длиться от 0 до 20 лет. Таблица 3.1 представляет собой статистический анализ длины 22 циклов с 1741 года и показывает, что они сильно различаются по длине и интенсивности. Между 1741 и 2007 насчитывают 22 цикла продолжительностью в среднем 10,4 года, хотя только один фактически длился 10 лет. Три цикла длились более 15 лет, три - 15 лет; один - 14 лет; один - 13 лет; три - 11 лет; один - 10 лет; три - 7 лет; два - 6 лет; два - 5 лет; один - 4 года; а также один – 3 года. С точки зрения статистики, стандартное отклонение составляет 4,9 года, так что, взяв 10.4 года за среднее значение, мы можем быть на 95% уверены, что циклы будут длиться от 0 до 20 лет. Таблица 3.1 также показывает длину пиков и спадов каждого цикла. Начало, конец и общая длина каждого циклического пика представлена в колонках 2-4, и та же информация для каждого спада рынка в колонках 5-7. И, наконец, колонка 8 показывает общую длину каждого цикла, включая пики и спады. Наконец, следует отметить, что между 1741 и 2007 годами было три крупных войны - наполеоновская война, Первая и Вторая мировые войны - и многочисленные меньшие войны и революции, так что это был довольно тернистый путь. Поскольку крупные войны подрывали рынок, статистика фрахта для этих периодов исключена из анализа. Самый длинный циклический пик, определяемый как период, когда грузовой индекс был стабильно выше долгосрочного тренда, длился 10 лет, в то время как самый длинный спад также длился 10 лет. Однако было много циклов, которые длились только 1 год и довольно часто случались 2-летние спады.