🗊 Презентация Session 6_Correlation

Категория: Образование

Нажмите для полного просмотра!
Session 6_Correlation, слайд №1 Session 6_Correlation, слайд №2 Session 6_Correlation, слайд №3 Session 6_Correlation, слайд №4 Session 6_Correlation, слайд №5 Session 6_Correlation, слайд №6 Session 6_Correlation, слайд №7 Session 6_Correlation, слайд №8 Session 6_Correlation, слайд №9 Session 6_Correlation, слайд №10 Session 6_Correlation, слайд №11 Session 6_Correlation, слайд №12 Session 6_Correlation, слайд №13 Session 6_Correlation, слайд №14 Session 6_Correlation, слайд №15 Session 6_Correlation, слайд №16

Вы можете ознакомиться и скачать презентацию на тему Session 6_Correlation. Доклад-сообщение содержит 16 слайдов. Презентации для любого класса можно скачать бесплатно. Если материал и наш сайт презентаций Mypresentation Вам понравились – поделитесь им с друзьями с помощью социальных кнопок и добавьте в закладки в своем браузере.

Слайды и текст этой презентации


Слайд 1


Session 6: Correlation Correlation Analysis and Covariance
Описание слайда:

Session 6: Correlation Correlation Analysis and Covariance

Слайд 2


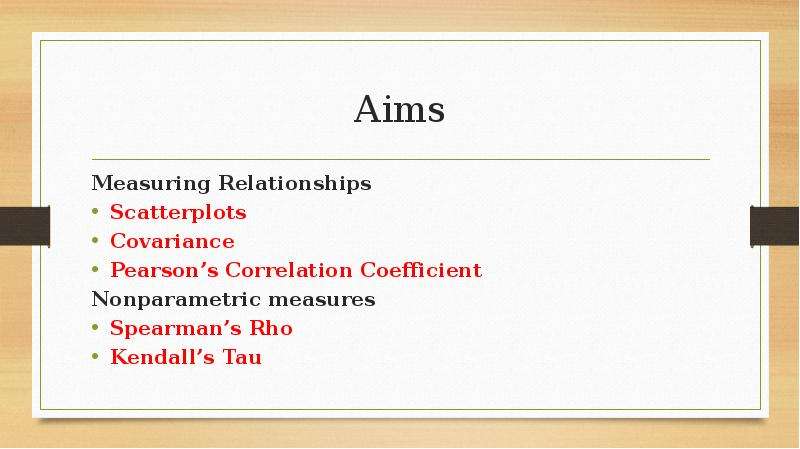
Aims Measuring Relationships Scatterplots Covariance Pearson’s Correlation Coefficient Nonparametric measures Spearman’s Rho Kendall’s Tau
Описание слайда:

Aims Measuring Relationships Scatterplots Covariance Pearson’s Correlation Coefficient Nonparametric measures Spearman’s Rho Kendall’s Tau

Слайд 3


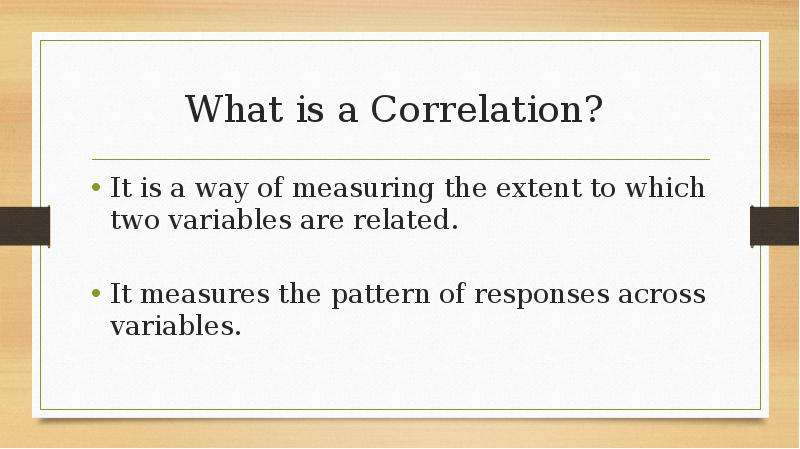
What is a Correlation? It is a way of measuring the extent to which two variables are related. It measures the pattern of responses across variables.
Описание слайда:

What is a Correlation? It is a way of measuring the extent to which two variables are related. It measures the pattern of responses across variables.

Слайд 4


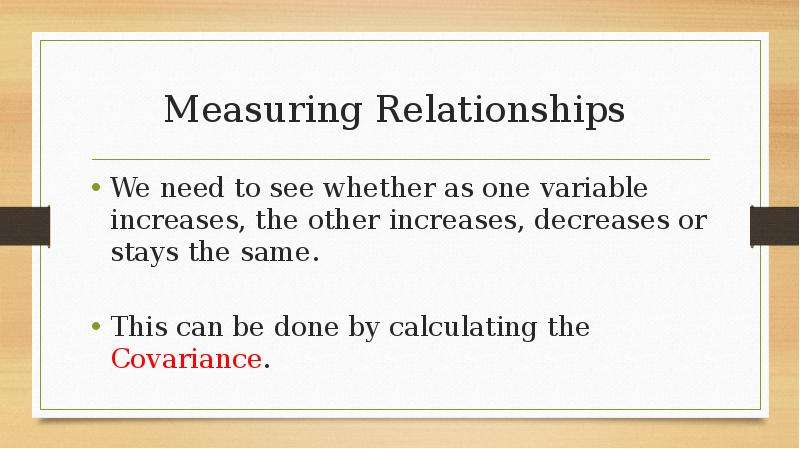
Measuring Relationships We need to see whether as one variable increases, the other increases, decreases or stays the same. This can be done by...
Описание слайда:

Measuring Relationships We need to see whether as one variable increases, the other increases, decreases or stays the same. This can be done by calculating the Covariance.

Слайд 5


Covariance Calculate the error between the mean and each subject’s score for the first variable (x). Calculate the error between the mean and their...
Описание слайда:
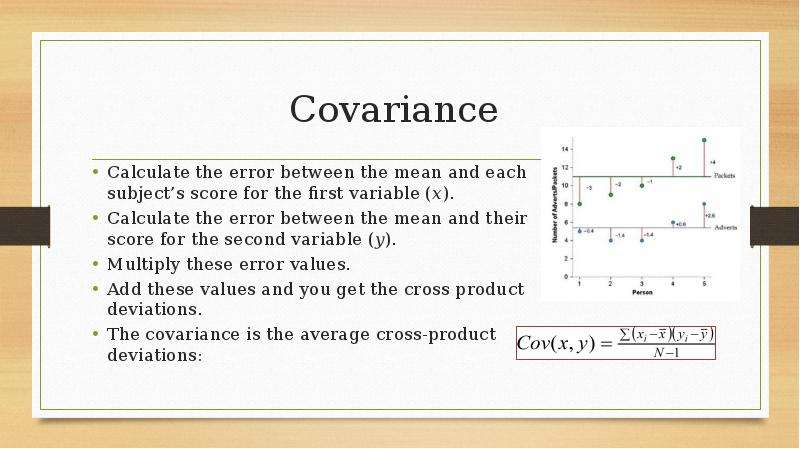
Covariance Calculate the error between the mean and each subject’s score for the first variable (x). Calculate the error between the mean and their score for the second variable (y). Multiply these error values. Add these values and you get the cross product deviations. The covariance is the average cross-product deviations:

Слайд 6


Problems with Covariance It depends upon the units of measurement. E.g. The Covariance of two variables measured in Miles might be 4.25, but if the...
Описание слайда:
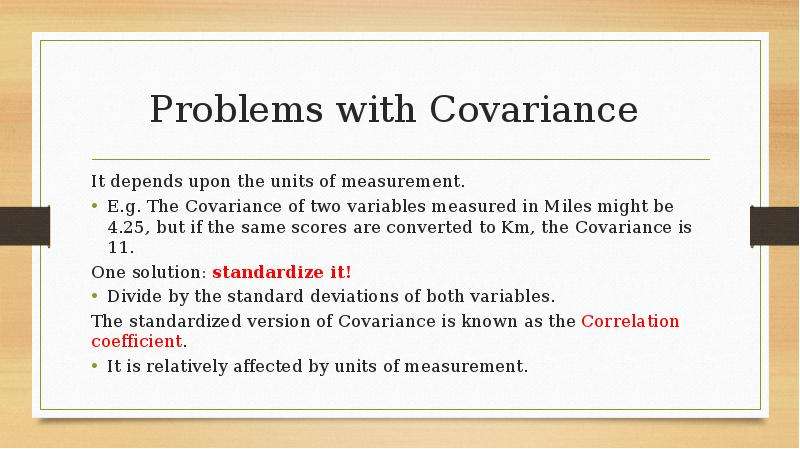
Problems with Covariance It depends upon the units of measurement. E.g. The Covariance of two variables measured in Miles might be 4.25, but if the same scores are converted to Km, the Covariance is 11. One solution: standardize it! Divide by the standard deviations of both variables. The standardized version of Covariance is known as the Correlation coefficient. It is relatively affected by units of measurement.

Слайд 7


The Correlation Coefficient (Pearson)
Описание слайда:
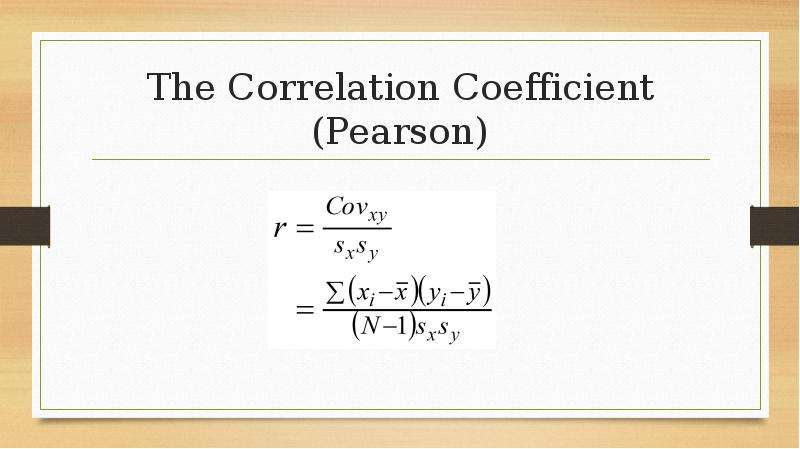
The Correlation Coefficient (Pearson)

Слайд 8


Conducting Correlation Analysis
Описание слайда:
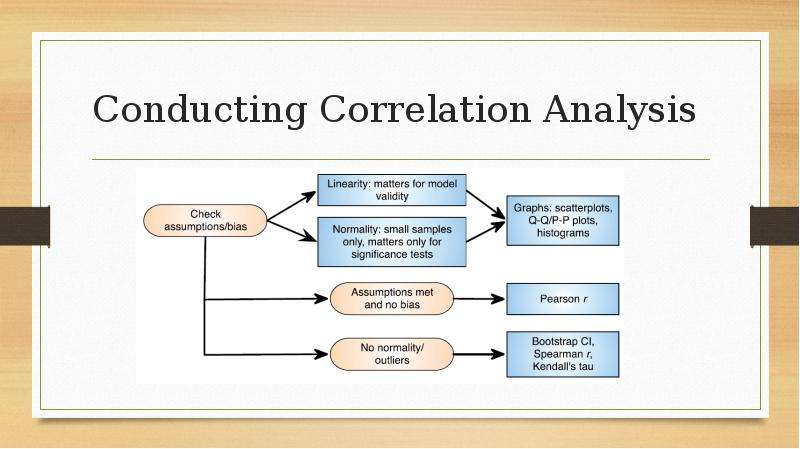
Conducting Correlation Analysis

Слайд 9


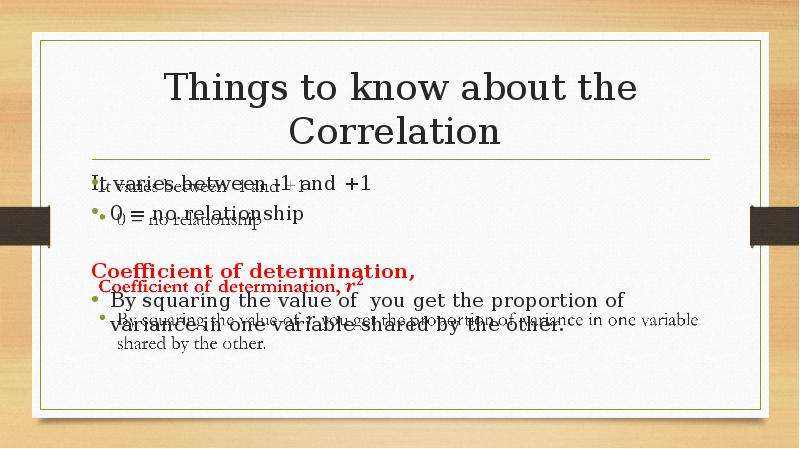
Things to know about the Correlation It varies between -1 and +1 0 = no relationship Coefficient of determination, By squaring the value of you get...
Описание слайда:
Things to know about the Correlation It varies between -1 and +1 0 = no relationship Coefficient of determination, By squaring the value of you get the proportion of variance in one variable shared by the other.

Слайд 10


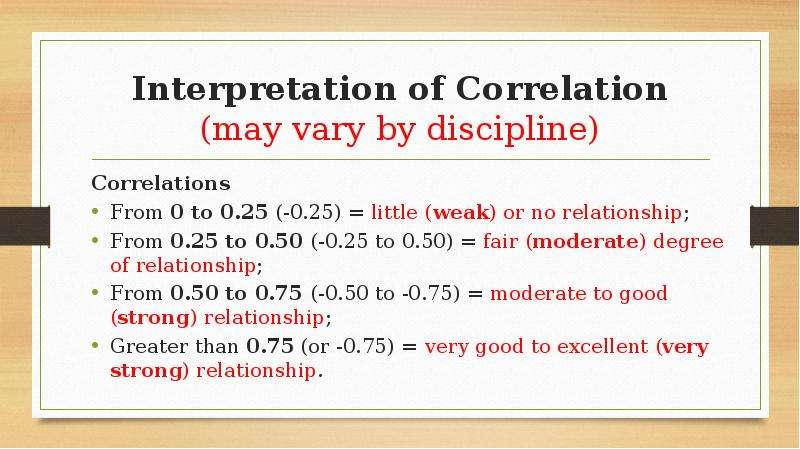
Interpretation of Correlation (may vary by discipline) Correlations From 0 to 0.25 (-0.25) = little (weak) or no relationship; From 0.25 to 0.50...
Описание слайда:
Interpretation of Correlation (may vary by discipline) Correlations From 0 to 0.25 (-0.25) = little (weak) or no relationship; From 0.25 to 0.50 (-0.25 to 0.50) = fair (moderate) degree of relationship; From 0.50 to 0.75 (-0.50 to -0.75) = moderate to good (strong) relationship; Greater than 0.75 (or -0.75) = very good to excellent (very strong) relationship.

Слайд 11


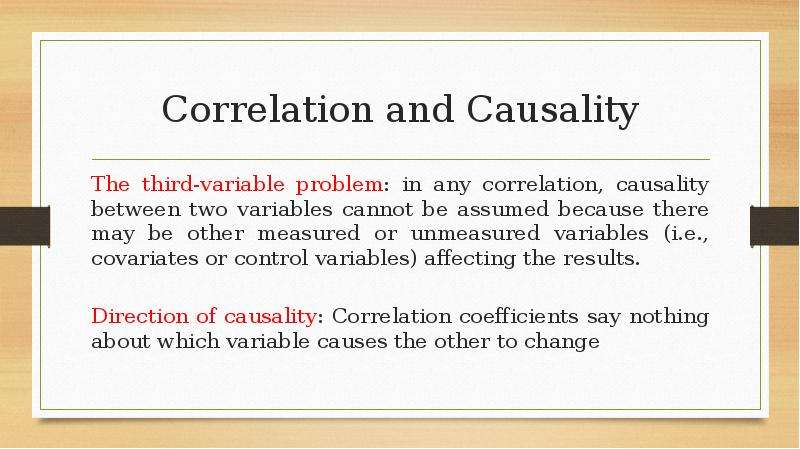
Correlation and Causality The third-variable problem: in any correlation, causality between two variables cannot be assumed because there may be...
Описание слайда:
Correlation and Causality The third-variable problem: in any correlation, causality between two variables cannot be assumed because there may be other measured or unmeasured variables (i.e., covariates or control variables) affecting the results. Direction of causality: Correlation coefficients say nothing about which variable causes the other to change

Слайд 12


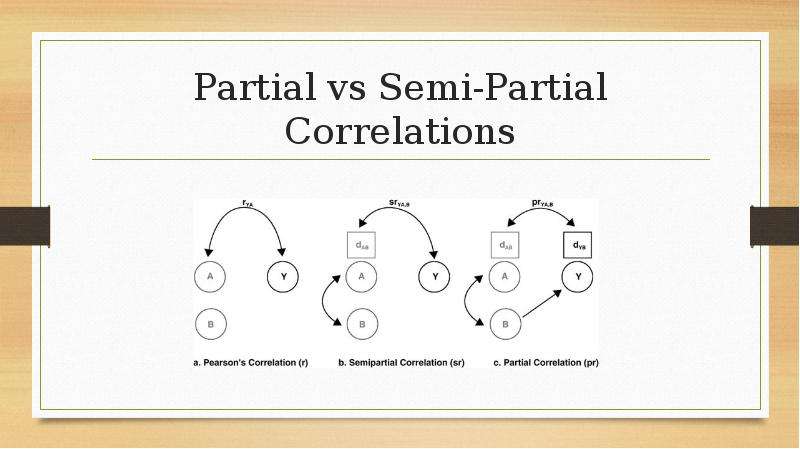
Partial vs Semi-Partial Correlations
Описание слайда:
Partial vs Semi-Partial Correlations

Слайд 13


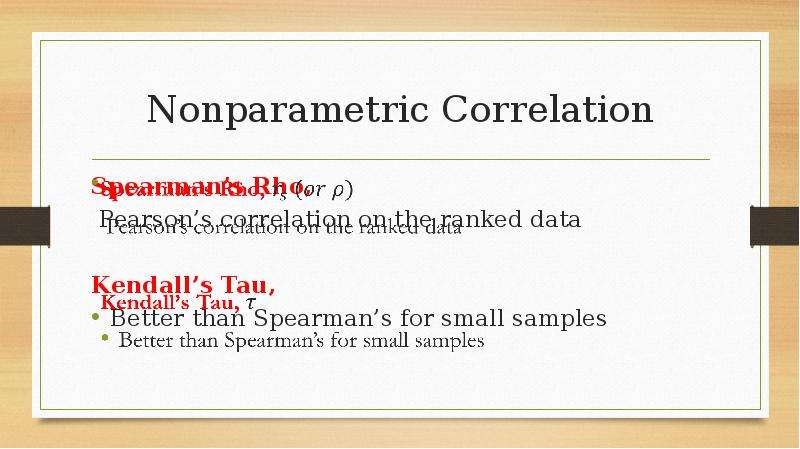
Nonparametric Correlation Spearman’s Rho, Pearson’s correlation on the ranked data Kendall’s Tau, Better than Spearman’s for small samples
Описание слайда:
Nonparametric Correlation Spearman’s Rho, Pearson’s correlation on the ranked data Kendall’s Tau, Better than Spearman’s for small samples

Слайд 14


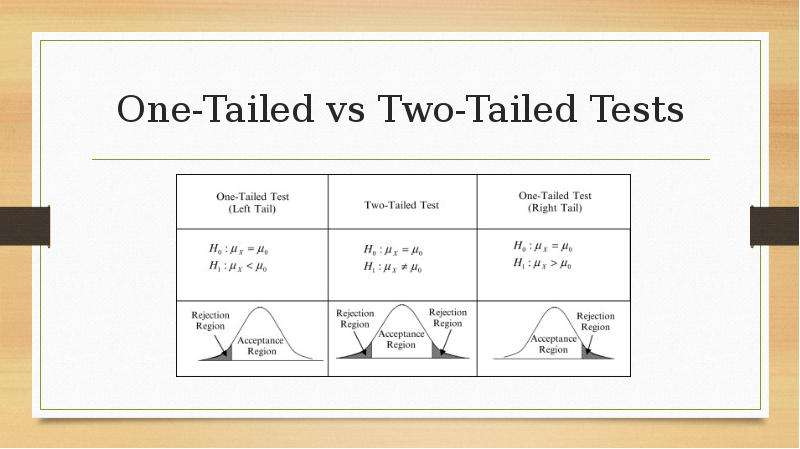
One-Tailed vs Two-Tailed Tests
Описание слайда:
One-Tailed vs Two-Tailed Tests

Слайд 15


Session 6_Correlation, слайд №15
Описание слайда:

Слайд 16


Session 6_Correlation, слайд №16
Описание слайда:


Теги Session Correlation
Похожие презентации
Mypresentation.ru
Загрузить презентацию