🗊Презентация Descriptive statistics. Frequency distributions and their graphs. (Section 2.1)

Категория: Математика
Нажмите для полного просмотра!
Descriptive statistics. Frequency distributions and their graphs. (Section 2.1), слайд №1Descriptive statistics. Frequency distributions and their graphs. (Section 2.1), слайд №2Descriptive statistics. Frequency distributions and their graphs. (Section 2.1), слайд №3Descriptive statistics. Frequency distributions and their graphs. (Section 2.1), слайд №4Descriptive statistics. Frequency distributions and their graphs. (Section 2.1), слайд №5Descriptive statistics. Frequency distributions and their graphs. (Section 2.1), слайд №6Descriptive statistics. Frequency distributions and their graphs. (Section 2.1), слайд №7Descriptive statistics. Frequency distributions and their graphs. (Section 2.1), слайд №8Descriptive statistics. Frequency distributions and their graphs. (Section 2.1), слайд №9Descriptive statistics. Frequency distributions and their graphs. (Section 2.1), слайд №10Descriptive statistics. Frequency distributions and their graphs. (Section 2.1), слайд №11Descriptive statistics. Frequency distributions and their graphs. (Section 2.1), слайд №12Descriptive statistics. Frequency distributions and their graphs. (Section 2.1), слайд №13Descriptive statistics. Frequency distributions and their graphs. (Section 2.1), слайд №14Descriptive statistics. Frequency distributions and their graphs. (Section 2.1), слайд №15Descriptive statistics. Frequency distributions and their graphs. (Section 2.1), слайд №16Descriptive statistics. Frequency distributions and their graphs. (Section 2.1), слайд №17Descriptive statistics. Frequency distributions and their graphs. (Section 2.1), слайд №18Descriptive statistics. Frequency distributions and their graphs. (Section 2.1), слайд №19Descriptive statistics. Frequency distributions and their graphs. (Section 2.1), слайд №20Descriptive statistics. Frequency distributions and their graphs. (Section 2.1), слайд №21Descriptive statistics. Frequency distributions and their graphs. (Section 2.1), слайд №22Descriptive statistics. Frequency distributions and their graphs. (Section 2.1), слайд №23Descriptive statistics. Frequency distributions and their graphs. (Section 2.1), слайд №24Descriptive statistics. Frequency distributions and their graphs. (Section 2.1), слайд №25Descriptive statistics. Frequency distributions and their graphs. (Section 2.1), слайд №26Descriptive statistics. Frequency distributions and their graphs. (Section 2.1), слайд №27Descriptive statistics. Frequency distributions and their graphs. (Section 2.1), слайд №28Descriptive statistics. Frequency distributions and their graphs. (Section 2.1), слайд №29Descriptive statistics. Frequency distributions and their graphs. (Section 2.1), слайд №30Descriptive statistics. Frequency distributions and their graphs. (Section 2.1), слайд №31Descriptive statistics. Frequency distributions and their graphs. (Section 2.1), слайд №32Descriptive statistics. Frequency distributions and their graphs. (Section 2.1), слайд №33Descriptive statistics. Frequency distributions and their graphs. (Section 2.1), слайд №34Descriptive statistics. Frequency distributions and their graphs. (Section 2.1), слайд №35Descriptive statistics. Frequency distributions and their graphs. (Section 2.1), слайд №36Descriptive statistics. Frequency distributions and their graphs. (Section 2.1), слайд №37Descriptive statistics. Frequency distributions and their graphs. (Section 2.1), слайд №38Descriptive statistics. Frequency distributions and their graphs. (Section 2.1), слайд №39Descriptive statistics. Frequency distributions and their graphs. (Section 2.1), слайд №40Descriptive statistics. Frequency distributions and their graphs. (Section 2.1), слайд №41Descriptive statistics. Frequency distributions and their graphs. (Section 2.1), слайд №42Descriptive statistics. Frequency distributions and their graphs. (Section 2.1), слайд №43Descriptive statistics. Frequency distributions and their graphs. (Section 2.1), слайд №44Descriptive statistics. Frequency distributions and their graphs. (Section 2.1), слайд №45Descriptive statistics. Frequency distributions and their graphs. (Section 2.1), слайд №46Descriptive statistics. Frequency distributions and their graphs. (Section 2.1), слайд №47Descriptive statistics. Frequency distributions and their graphs. (Section 2.1), слайд №48Descriptive statistics. Frequency distributions and their graphs. (Section 2.1), слайд №49Descriptive statistics. Frequency distributions and their graphs. (Section 2.1), слайд №50Descriptive statistics. Frequency distributions and their graphs. (Section 2.1), слайд №51Descriptive statistics. Frequency distributions and their graphs. (Section 2.1), слайд №52Descriptive statistics. Frequency distributions and their graphs. (Section 2.1), слайд №53Descriptive statistics. Frequency distributions and their graphs. (Section 2.1), слайд №54Descriptive statistics. Frequency distributions and their graphs. (Section 2.1), слайд №55Descriptive statistics. Frequency distributions and their graphs. (Section 2.1), слайд №56Descriptive statistics. Frequency distributions and their graphs. (Section 2.1), слайд №57Descriptive statistics. Frequency distributions and their graphs. (Section 2.1), слайд №58Descriptive statistics. Frequency distributions and their graphs. (Section 2.1), слайд №59Descriptive statistics. Frequency distributions and their graphs. (Section 2.1), слайд №60Descriptive statistics. Frequency distributions and their graphs. (Section 2.1), слайд №61Descriptive statistics. Frequency distributions and their graphs. (Section 2.1), слайд №62Descriptive statistics. Frequency distributions and their graphs. (Section 2.1), слайд №63Descriptive statistics. Frequency distributions and their graphs. (Section 2.1), слайд №64Descriptive statistics. Frequency distributions and their graphs. (Section 2.1), слайд №65Descriptive statistics. Frequency distributions and their graphs. (Section 2.1), слайд №66Descriptive statistics. Frequency distributions and their graphs. (Section 2.1), слайд №67Descriptive statistics. Frequency distributions and their graphs. (Section 2.1), слайд №68

Содержание

Вы можете ознакомиться и скачать презентацию на тему Descriptive statistics. Frequency distributions and their graphs. (Section 2.1). Доклад-сообщение содержит 68 слайдов. Презентации для любого класса можно скачать бесплатно. Если материал и наш сайт презентаций Mypresentation Вам понравились – поделитесь им с друзьями с помощью социальных кнопок и добавьте в закладки в своем браузере.
Слайды и текст этой презентации


Слайд 1


Descriptive Statistics
Описание слайда:
Descriptive Statistics

Слайд 2


Section 2.1
Описание слайда:
Section 2.1

Слайд 3


Frequency Distributions
 102	124	108	  86	103	 82
  71	104	112	118	  87	 95
103	116	  85	122	  87    100
105	  97	107	  67	  78    125
109	  99	105	  99	101	 92
Описание слайда:
Frequency Distributions 102 124 108 86 103 82 71 104 112 118 87 95 103 116 85 122 87 100 105 97 107 67 78 125 109 99 105 99 101 92

Слайд 4


Frequency Distributions
Описание слайда:
Frequency Distributions

Слайд 5


Frequency Distributions
Описание слайда:
Frequency Distributions

Слайд 6


Construct a Frequency Distribution
Описание слайда:
Construct a Frequency Distribution

Слайд 7


Other Information
Описание слайда:
Other Information

Слайд 8


Frequency Histogram
Описание слайда:
Frequency Histogram

Слайд 9


Frequency Histogram
Описание слайда:
Frequency Histogram

Слайд 10


Relative Frequency Histogram
Описание слайда:
Relative Frequency Histogram

Слайд 11


Relative Frequency Histogram
Описание слайда:
Relative Frequency Histogram

Слайд 12


Frequency Polygon
Описание слайда:
Frequency Polygon

Слайд 13


Frequency Polygon
Описание слайда:
Frequency Polygon

Слайд 14


Ogive
Описание слайда:
Ogive

Слайд 15


Ogive
Описание слайда:
Ogive

Слайд 16


Section 2.2
Описание слайда:
Section 2.2

Слайд 17


Stem-and-Leaf Plot
 102	124	108	  86	103	 82
  71	104	112	118	  87	 95
103	116	  85	122	  87    100
105	  97	107	  67	  78    125
109	  99	105	  99	101	 92
Описание слайда:
Stem-and-Leaf Plot 102 124 108 86 103 82 71 104 112 118 87 95 103 116 85 122 87 100 105 97 107 67 78 125 109 99 105 99 101 92

Слайд 18


Stem-and-Leaf Plot
 6 |
 7 |
 8 |
 9 |
10 |
11 | 
12 |
Описание слайда:
Stem-and-Leaf Plot 6 | 7 | 8 | 9 | 10 | 11 | 12 |

Слайд 19


Stem-and-Leaf Plot
      6  | 7
      7  | 1 8
      8  | 2 5 6 7 7
      9  | 2 5 7 9 9
     10 | 0 1 2 3 3 4 5 5 7 8 9
     11 | 2 6 8
     12 | 2 4 5
Описание слайда:
Stem-and-Leaf Plot 6 | 7 7 | 1 8 8 | 2 5 6 7 7 9 | 2 5 7 9 9 10 | 0 1 2 3 3 4 5 5 7 8 9 11 | 2 6 8 12 | 2 4 5

Слайд 20


Stem-and-Leaf with two lines per stem
  	         6 | 7
		  7 | 1
     	  7 | 8
     	  8 | 2
    		  8 | 5 6 7 7
    	 	  9 | 2
     	  9 | 5 7 9 9
    		10 | 0 1 2 3 3 4
    		10 | 5 5 7 8 9
    		11 | 2
    		11 | 6 8
    		12 | 2 4
    		12 | 5
Описание слайда:
Stem-and-Leaf with two lines per stem 6 | 7 7 | 1 7 | 8 8 | 2 8 | 5 6 7 7 9 | 2 9 | 5 7 9 9 10 | 0 1 2 3 3 4 10 | 5 5 7 8 9 11 | 2 11 | 6 8 12 | 2 4 12 | 5

Слайд 21


Dot Plot
Описание слайда:
Dot Plot

Слайд 22


Pie Chart / Circle Graph
Used to describe parts of a whole
Central Angle for each segment
Описание слайда:
Pie Chart / Circle Graph Used to describe parts of a whole Central Angle for each segment

Слайд 23


Pie Chart
Описание слайда:
Pie Chart

Слайд 24


Pareto Chart
Описание слайда:
Pareto Chart

Слайд 25


Scatter Plot
Описание слайда:
Scatter Plot

Слайд 26


Time Series Chart / Line Graph
Описание слайда:
Time Series Chart / Line Graph

Слайд 27


Section 2.3
Описание слайда:
Section 2.3

Слайд 28


Measures of Central Tendency
Mean: The sum of all data values divided by the number of values 
    For a population:		    For a sample:
Описание слайда:
Measures of Central Tendency Mean: The sum of all data values divided by the number of values For a population: For a sample:

Слайд 29


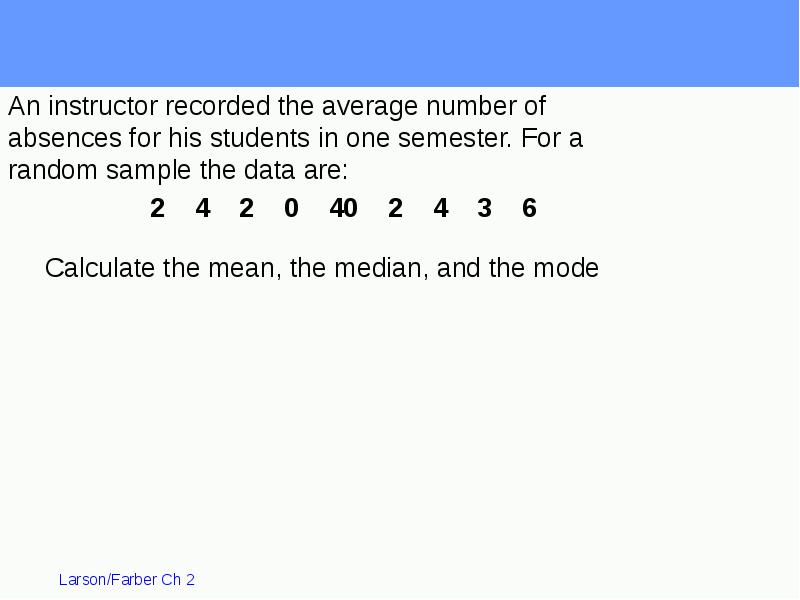
An instructor recorded the average number of absences for his students in one semester. For a random sample the data are:
Описание слайда:
An instructor recorded the average number of absences for his students in one semester. For a random sample the data are: An instructor recorded the average number of absences for his students in one semester. For a random sample the data are:

Слайд 30


An instructor recorded the average number of absences for his students in one semester. For a random sample the data are:
Описание слайда:
An instructor recorded the average number of absences for his students in one semester. For a random sample the data are: An instructor recorded the average number of absences for his students in one semester. For a random sample the data are:

Слайд 31


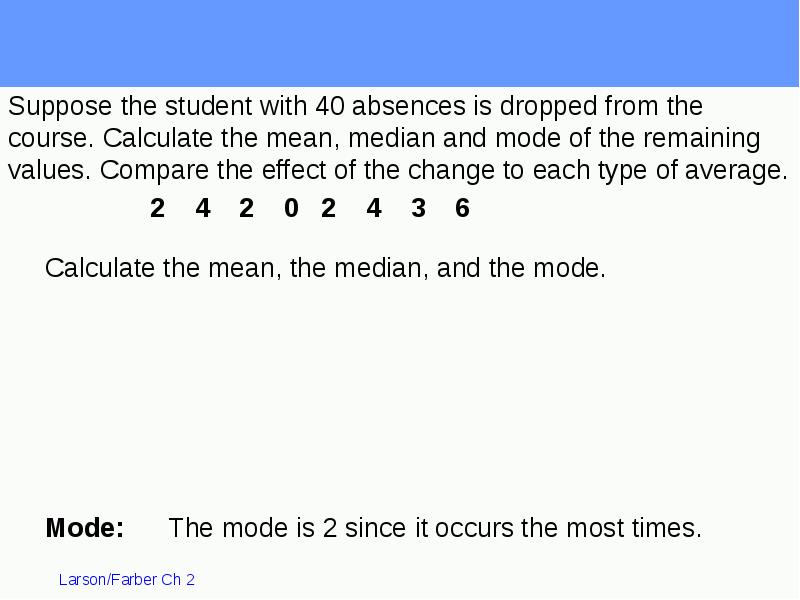
Suppose the student with 40 absences is dropped from the course. Calculate the mean, median and mode of the remaining values. Compare the effect of the change to each type of average.
Описание слайда:
Suppose the student with 40 absences is dropped from the course. Calculate the mean, median and mode of the remaining values. Compare the effect of the change to each type of average. Suppose the student with 40 absences is dropped from the course. Calculate the mean, median and mode of the remaining values. Compare the effect of the change to each type of average.

Слайд 32


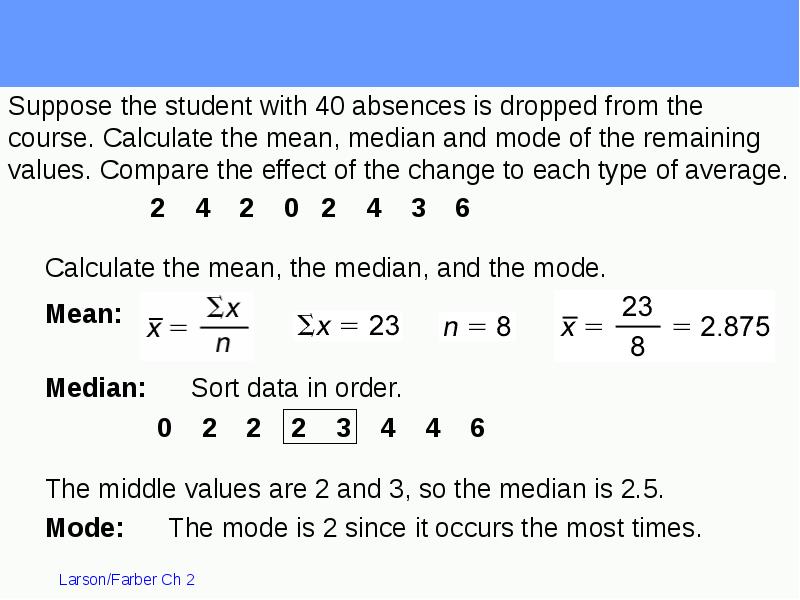
Suppose the student with 40 absences is dropped from the course. Calculate the mean, median and mode of the remaining values. Compare the effect of the change to each type of average.
Описание слайда:
Suppose the student with 40 absences is dropped from the course. Calculate the mean, median and mode of the remaining values. Compare the effect of the change to each type of average. Suppose the student with 40 absences is dropped from the course. Calculate the mean, median and mode of the remaining values. Compare the effect of the change to each type of average.

Слайд 33


Shapes of Distributions
Описание слайда:
Shapes of Distributions

Слайд 34


Descriptive statistics. Frequency distributions and their graphs. (Section 2.1), слайд №34
Описание слайда:

Слайд 35


Descriptive statistics. Frequency distributions and their graphs. (Section 2.1), слайд №35
Описание слайда:

Слайд 36


Descriptive statistics. Frequency distributions and their graphs. (Section 2.1), слайд №36
Описание слайда:

Слайд 37


Descriptive statistics. Frequency distributions and their graphs. (Section 2.1), слайд №37
Описание слайда:

Слайд 38


Section 2.4
Описание слайда:
Section 2.4

Слайд 39


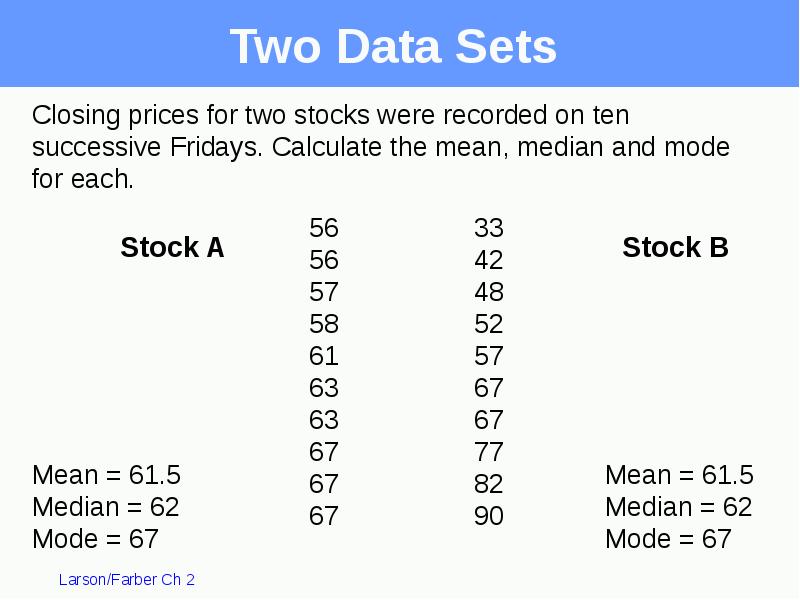
Two Data Sets
Описание слайда:
Two Data Sets

Слайд 40


Two Data Sets
Описание слайда:
Two Data Sets

Слайд 41


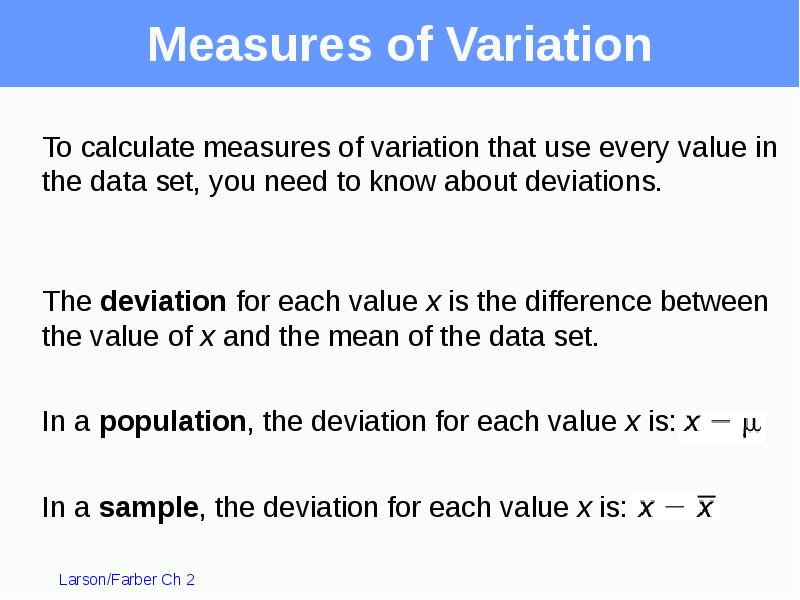
Measures of Variation
Описание слайда:
Measures of Variation

Слайд 42


Measures of Variation
Описание слайда:
Measures of Variation

Слайд 43


Descriptive statistics. Frequency distributions and their graphs. (Section 2.1), слайд №43
Описание слайда:

Слайд 44


Population Variance
Описание слайда:
Population Variance

Слайд 45


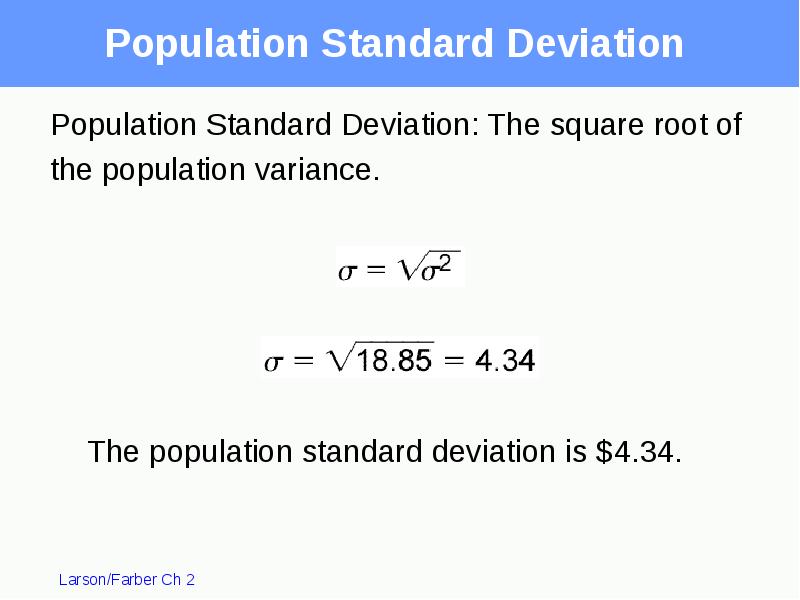
Population Standard Deviation
Описание слайда:
Population Standard Deviation

Слайд 46


Sample Variance and Standard Deviation
Описание слайда:
Sample Variance and Standard Deviation

Слайд 47


Interpreting Standard Deviation
Описание слайда:
Interpreting Standard Deviation

Слайд 48


Summary
Описание слайда:
Summary

Слайд 49


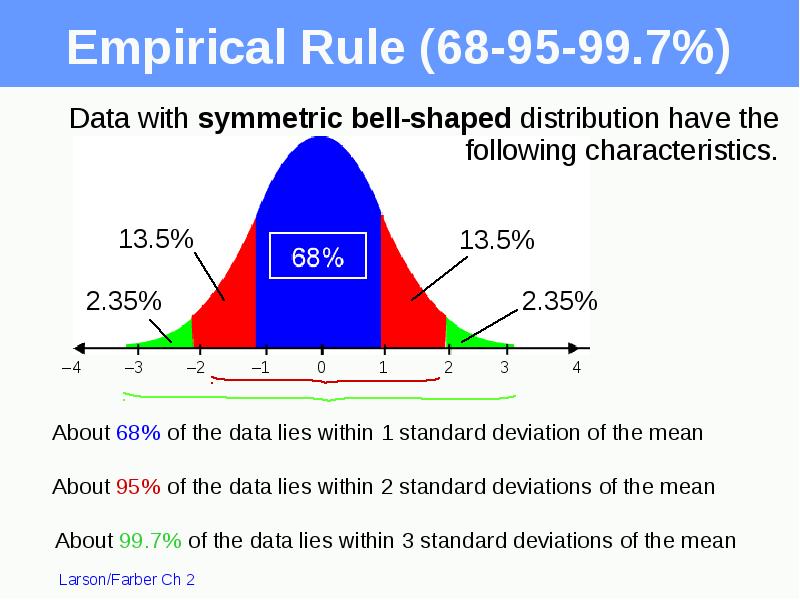
Empirical Rule (68-95-99.7%)
Data with symmetric bell-shaped distribution have the following characteristics.
Описание слайда:
Empirical Rule (68-95-99.7%) Data with symmetric bell-shaped distribution have the following characteristics.

Слайд 50


Using the Empirical Rule

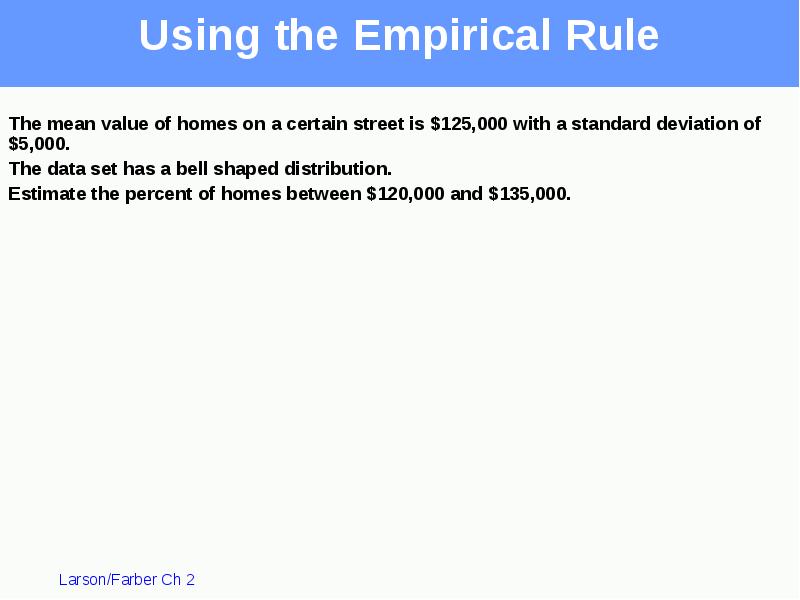
The mean value of homes on a certain street is $125,000 with a standard deviation of $5,000. 
The data set has a bell shaped distribution. 
Estimate the percent of homes between $120,000 and $135,000.
Описание слайда:
Using the Empirical Rule The mean value of homes on a certain street is $125,000 with a standard deviation of $5,000. The data set has a bell shaped distribution. Estimate the percent of homes between $120,000 and $135,000.

Слайд 51


Using the Empirical Rule
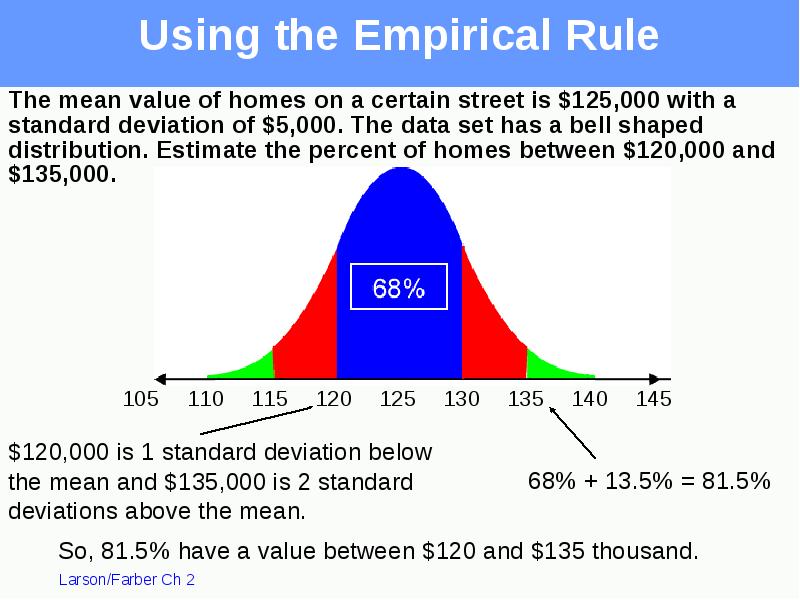
The mean value of homes on a certain street is $125,000 with a standard deviation of $5,000. The data set has a bell shaped distribution. Estimate the percent of homes between $120,000 and $135,000.
Описание слайда:
Using the Empirical Rule The mean value of homes on a certain street is $125,000 with a standard deviation of $5,000. The data set has a bell shaped distribution. Estimate the percent of homes between $120,000 and $135,000.

Слайд 52


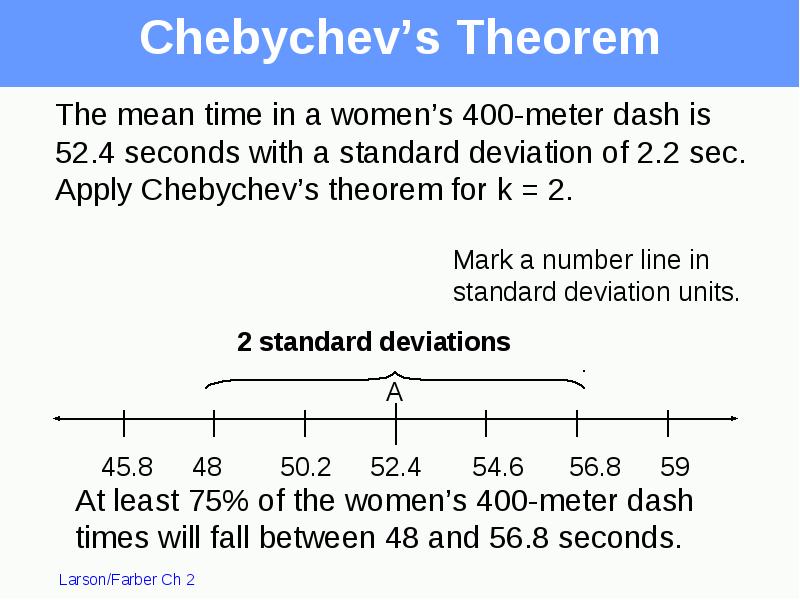
Chebychev’s Theorem
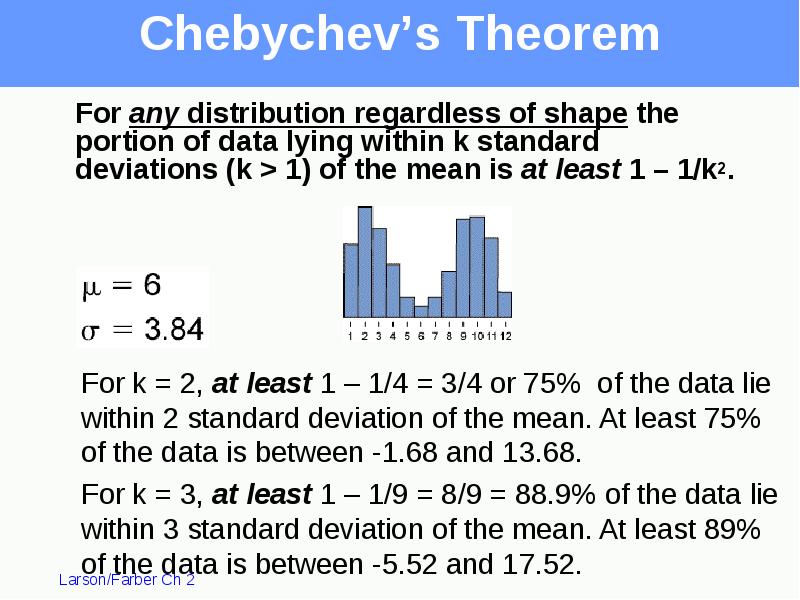
For any distribution regardless of shape the portion of data lying within k standard deviations (k > 1) of the mean is at least 1 – 1/k2.
Описание слайда:
Chebychev’s Theorem For any distribution regardless of shape the portion of data lying within k standard deviations (k > 1) of the mean is at least 1 – 1/k2.

Слайд 53


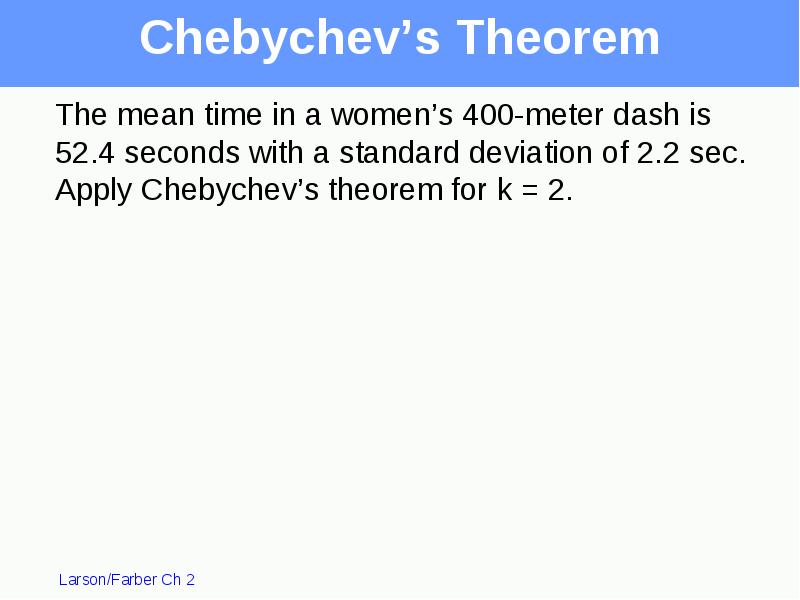
Chebychev’s Theorem
Описание слайда:
Chebychev’s Theorem

Слайд 54


Chebychev’s Theorem
Описание слайда:
Chebychev’s Theorem

Слайд 55


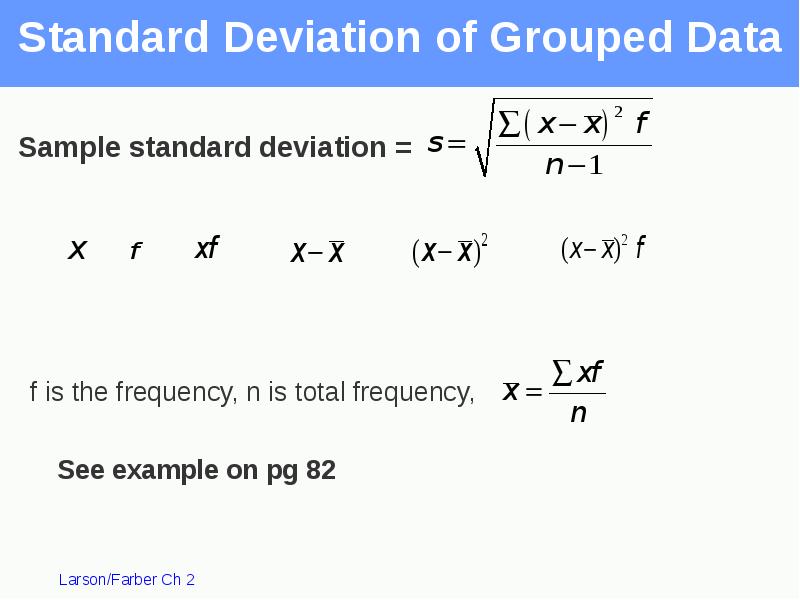
Standard Deviation of Grouped Data
Описание слайда:
Standard Deviation of Grouped Data

Слайд 56


Estimates with Classes
Описание слайда:
Estimates with Classes

Слайд 57


Section 2.5
Описание слайда:
Section 2.5

Слайд 58


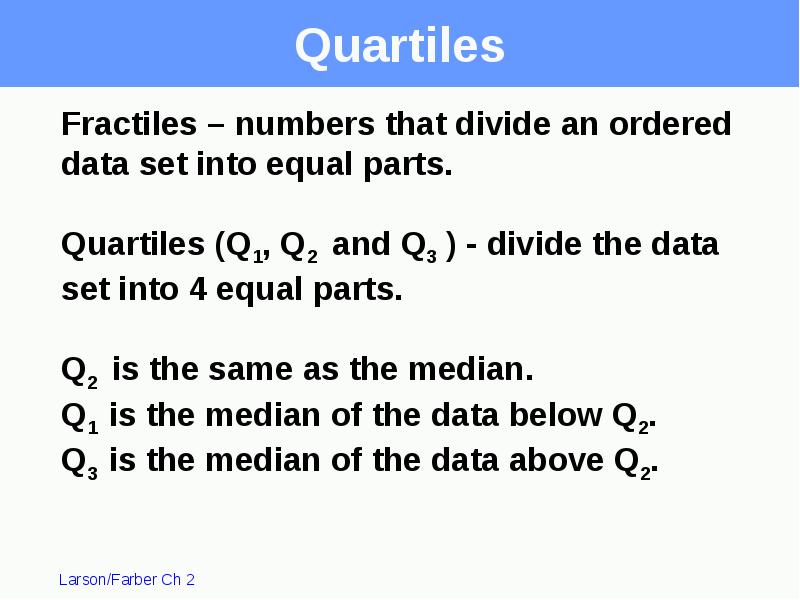
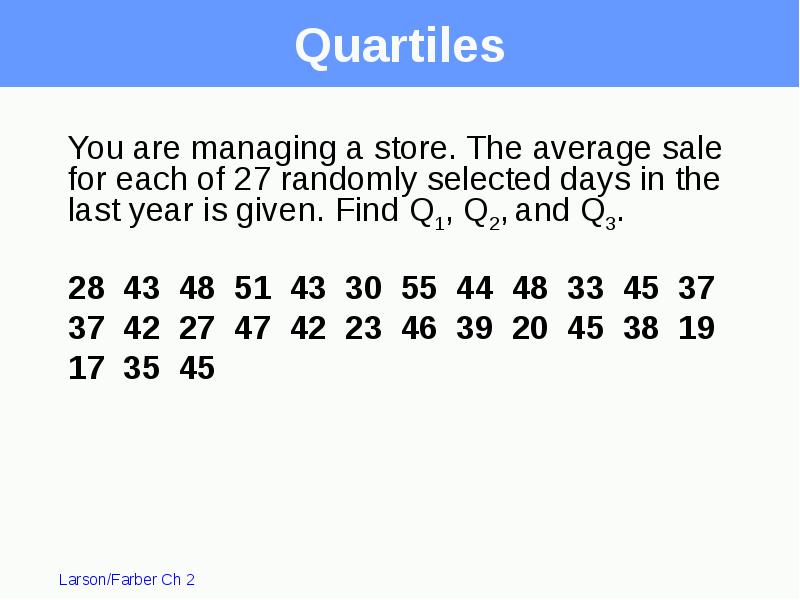
Quartiles
Описание слайда:
Quartiles

Слайд 59


Quartiles
Описание слайда:
Quartiles

Слайд 60


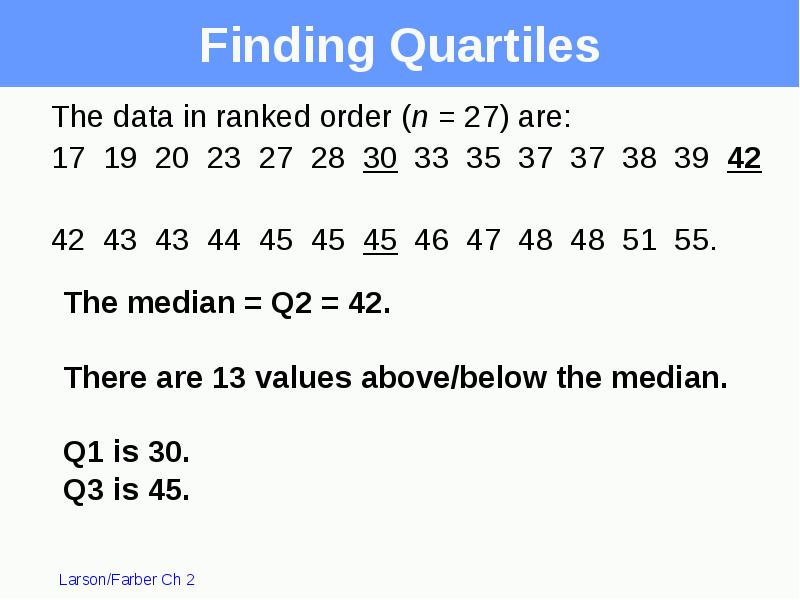
Finding Quartiles
Описание слайда:
Finding Quartiles

Слайд 61


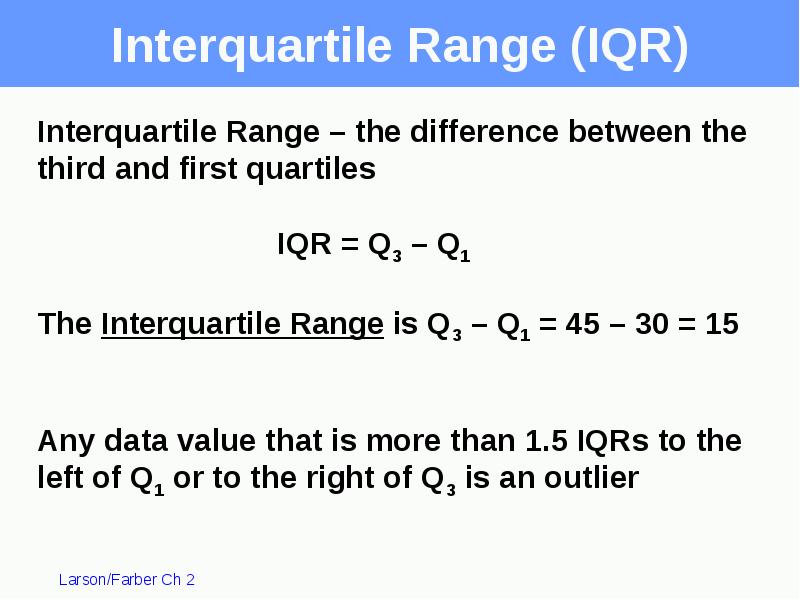
Interquartile Range (IQR)
Описание слайда:
Interquartile Range (IQR)

Слайд 62


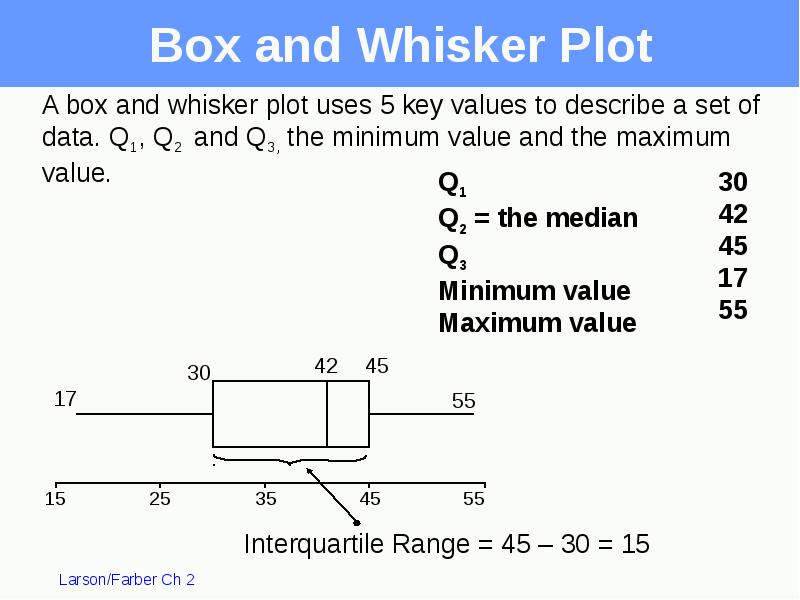
Box and Whisker Plot
Описание слайда:
Box and Whisker Plot

Слайд 63


Percentiles
Описание слайда:
Percentiles

Слайд 64


Percentiles
Описание слайда:
Percentiles

Слайд 65


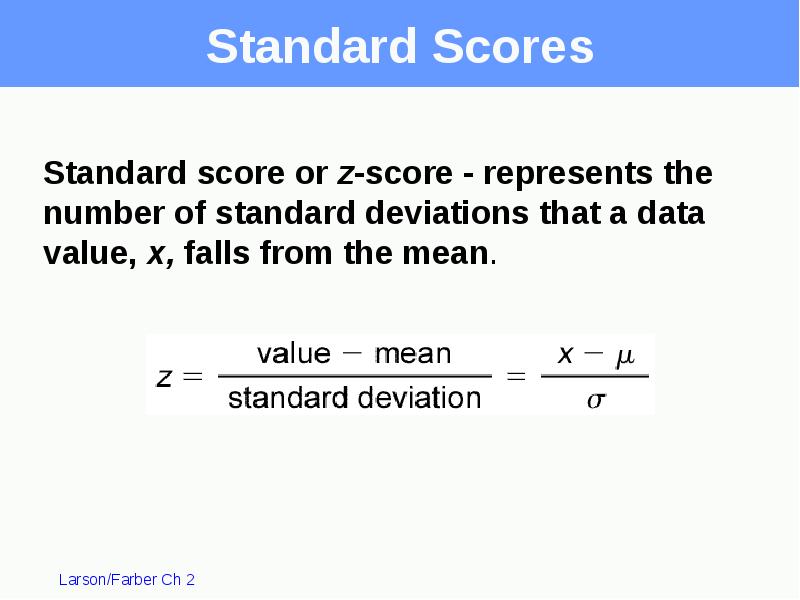
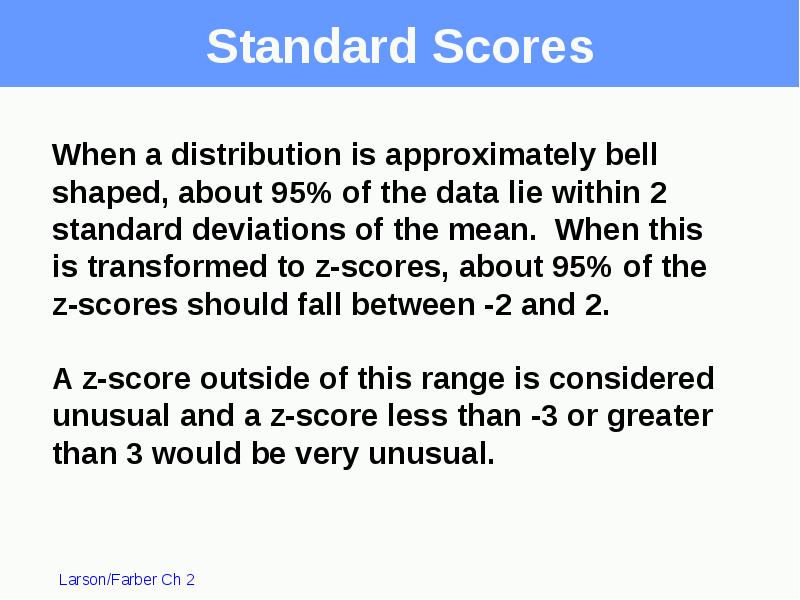
Standard Scores
Описание слайда:
Standard Scores

Слайд 66


Standard Scores
Описание слайда:
Standard Scores

Слайд 67


Calculations of z-Scores
Описание слайда:
Calculations of z-Scores

Слайд 68


Standard Scores
Описание слайда:
Standard Scores


Похожие презентации
Mypresentation.ru
Загрузить презентацию