🗊Презентация Discrete random variables – expected variance and standard deviation. Discrete Probability Distributions. Week 7 (1)

Категория: Математика
Нажмите для полного просмотра!
Discrete random variables – expected variance and standard deviation. Discrete Probability Distributions. Week 7 (1), слайд №1Discrete random variables – expected variance and standard deviation. Discrete Probability Distributions. Week 7 (1), слайд №2Discrete random variables – expected variance and standard deviation. Discrete Probability Distributions. Week 7 (1), слайд №3Discrete random variables – expected variance and standard deviation. Discrete Probability Distributions. Week 7 (1), слайд №4Discrete random variables – expected variance and standard deviation. Discrete Probability Distributions. Week 7 (1), слайд №5Discrete random variables – expected variance and standard deviation. Discrete Probability Distributions. Week 7 (1), слайд №6Discrete random variables – expected variance and standard deviation. Discrete Probability Distributions. Week 7 (1), слайд №7Discrete random variables – expected variance and standard deviation. Discrete Probability Distributions. Week 7 (1), слайд №8Discrete random variables – expected variance and standard deviation. Discrete Probability Distributions. Week 7 (1), слайд №9Discrete random variables – expected variance and standard deviation. Discrete Probability Distributions. Week 7 (1), слайд №10Discrete random variables – expected variance and standard deviation. Discrete Probability Distributions. Week 7 (1), слайд №11Discrete random variables – expected variance and standard deviation. Discrete Probability Distributions. Week 7 (1), слайд №12Discrete random variables – expected variance and standard deviation. Discrete Probability Distributions. Week 7 (1), слайд №13Discrete random variables – expected variance and standard deviation. Discrete Probability Distributions. Week 7 (1), слайд №14Discrete random variables – expected variance and standard deviation. Discrete Probability Distributions. Week 7 (1), слайд №15Discrete random variables – expected variance and standard deviation. Discrete Probability Distributions. Week 7 (1), слайд №16Discrete random variables – expected variance and standard deviation. Discrete Probability Distributions. Week 7 (1), слайд №17Discrete random variables – expected variance and standard deviation. Discrete Probability Distributions. Week 7 (1), слайд №18Discrete random variables – expected variance and standard deviation. Discrete Probability Distributions. Week 7 (1), слайд №19Discrete random variables – expected variance and standard deviation. Discrete Probability Distributions. Week 7 (1), слайд №20Discrete random variables – expected variance and standard deviation. Discrete Probability Distributions. Week 7 (1), слайд №21Discrete random variables – expected variance and standard deviation. Discrete Probability Distributions. Week 7 (1), слайд №22Discrete random variables – expected variance and standard deviation. Discrete Probability Distributions. Week 7 (1), слайд №23Discrete random variables – expected variance and standard deviation. Discrete Probability Distributions. Week 7 (1), слайд №24Discrete random variables – expected variance and standard deviation. Discrete Probability Distributions. Week 7 (1), слайд №25Discrete random variables – expected variance and standard deviation. Discrete Probability Distributions. Week 7 (1), слайд №26Discrete random variables – expected variance and standard deviation. Discrete Probability Distributions. Week 7 (1), слайд №27Discrete random variables – expected variance and standard deviation. Discrete Probability Distributions. Week 7 (1), слайд №28Discrete random variables – expected variance and standard deviation. Discrete Probability Distributions. Week 7 (1), слайд №29Discrete random variables – expected variance and standard deviation. Discrete Probability Distributions. Week 7 (1), слайд №30Discrete random variables – expected variance and standard deviation. Discrete Probability Distributions. Week 7 (1), слайд №31Discrete random variables – expected variance and standard deviation. Discrete Probability Distributions. Week 7 (1), слайд №32Discrete random variables – expected variance and standard deviation. Discrete Probability Distributions. Week 7 (1), слайд №33Discrete random variables – expected variance and standard deviation. Discrete Probability Distributions. Week 7 (1), слайд №34Discrete random variables – expected variance and standard deviation. Discrete Probability Distributions. Week 7 (1), слайд №35Discrete random variables – expected variance and standard deviation. Discrete Probability Distributions. Week 7 (1), слайд №36Discrete random variables – expected variance and standard deviation. Discrete Probability Distributions. Week 7 (1), слайд №37Discrete random variables – expected variance and standard deviation. Discrete Probability Distributions. Week 7 (1), слайд №38Discrete random variables – expected variance and standard deviation. Discrete Probability Distributions. Week 7 (1), слайд №39Discrete random variables – expected variance and standard deviation. Discrete Probability Distributions. Week 7 (1), слайд №40Discrete random variables – expected variance and standard deviation. Discrete Probability Distributions. Week 7 (1), слайд №41Discrete random variables – expected variance and standard deviation. Discrete Probability Distributions. Week 7 (1), слайд №42Discrete random variables – expected variance and standard deviation. Discrete Probability Distributions. Week 7 (1), слайд №43Discrete random variables – expected variance and standard deviation. Discrete Probability Distributions. Week 7 (1), слайд №44Discrete random variables – expected variance and standard deviation. Discrete Probability Distributions. Week 7 (1), слайд №45Discrete random variables – expected variance and standard deviation. Discrete Probability Distributions. Week 7 (1), слайд №46

Содержание
Вы можете ознакомиться и скачать презентацию на тему Discrete random variables – expected variance and standard deviation. Discrete Probability Distributions. Week 7 (1). Доклад-сообщение содержит 46 слайдов. Презентации для любого класса можно скачать бесплатно. Если материал и наш сайт презентаций Mypresentation Вам понравились – поделитесь им с друзьями с помощью социальных кнопок и добавьте в закладки в своем браузере.
Слайды и текст этой презентации


Слайд 1


BBA182 Applied Statistics
Week 7 (1)Discrete random variables – expected variance and standard deviation
Discrete Probability Distributions
Dr Susanne Hansen Saral
Email: susanne.saral@okan.edu.tr
https://piazza.com/class/ixrj5mmox1u2t8?cid=4#
www.khanacademy.org
Описание слайда:
BBA182 Applied Statistics Week 7 (1)Discrete random variables – expected variance and standard deviation Discrete Probability Distributions Dr Susanne Hansen Saral Email: susanne.saral@okan.edu.tr https://piazza.com/class/ixrj5mmox1u2t8?cid=4# www.khanacademy.org

Слайд 2


	   Cumulative Probability Function, F()
                                Practical application
Описание слайда:
Cumulative Probability Function, F() Practical application

Слайд 3


	   Cumulative Probability Function, F(x0)
                  Practical application: Car dealer
Описание слайда:
Cumulative Probability Function, F(x0) Practical application: Car dealer

Слайд 4


	   Cumulative Probability Function, F(x0)
                          Practical application
Описание слайда:
Cumulative Probability Function, F(x0) Practical application

Слайд 5


	   Cumulative Probability Function, F(x0)
                          Practical application
Описание слайда:
Cumulative Probability Function, F(x0) Practical application

Слайд 6


           Properties of discrete random variables: 
           Expected value 
             
The expected value, E[X], also called the mean,  of a discrete random variable is found by multiplying each possible value of the random variable by the probability that it occurs and then summing all the products:
The expected value of tossing two coins simultaneously is :
Описание слайда:
Properties of discrete random variables: Expected value The expected value, E[X], also called the mean, of a discrete random variable is found by multiplying each possible value of the random variable by the probability that it occurs and then summing all the products: The expected value of tossing two coins simultaneously is :

Слайд 7


             Expected value for a discrete random variable
           			    Exercise
X is a discrete random variable. The graph below defines a probability distribution, P(X) for X.
What is the expected value of X?
 
Описание слайда:
Expected value for a discrete random variable Exercise X is a discrete random variable. The graph below defines a probability distribution, P(X) for X. What is the expected value of X?  

Слайд 8


         Expected value for a discrete random variable
X is a discrete random variable. The graph below defines a probability distribution, P(X) for X.
What is the expected value of X?
 
Описание слайда:
Expected value for a discrete random variable X is a discrete random variable. The graph below defines a probability distribution, P(X) for X. What is the expected value of X?  

Слайд 9


		Expected variance
                 of a Discrete Random Variables
The measurements of central tendency and variation for discrete random variables: 
 Expected value E[X] of a discrete random variable - expectations

 Expected Variance, of a discrete random variable
 Expected Standard deviation,  of a discrete random variable
Описание слайда:
Expected variance of a Discrete Random Variables The measurements of central tendency and variation for discrete random variables: Expected value E[X] of a discrete random variable - expectations Expected Variance, of a discrete random variable Expected Standard deviation, of a discrete random variable

Слайд 10


	Variance of a discrete random variable
The variance is the measure of the spread of a set of numerical observations to the expected value, E[X].
For a discrete random variable we define the variance as the weighted average of the squares of its possible deviations  (x - ):
Описание слайда:
Variance of a discrete random variable The variance is the measure of the spread of a set of numerical observations to the expected value, E[X]. For a discrete random variable we define the variance as the weighted average of the squares of its possible deviations (x - ):

Слайд 11


	      Variance and Standard Deviation
Let X be a discrete random variable. The expectation of the average of squared
 deviations about the mean, , is called the expected variance, denoted  and given
 by:
   
Expected Standard Deviation of a discrete random variable X
Описание слайда:
Variance and Standard Deviation Let X be a discrete random variable. The expectation of the average of squared deviations about the mean, , is called the expected variance, denoted and given by: Expected Standard Deviation of a discrete random variable X

Слайд 12


		Exercise:
  n  n         Expected value,E[X], and variance,  of car sales
At a car dealer the number of cars sold daily could vary between 0 and 5 cars, with the probabilities given in the table. Find the expected value and variance for this probability distribution
Описание слайда:
Exercise: n n Expected value,E[X], and variance, of car sales At a car dealer the number of cars sold daily could vary between 0 and 5 cars, with the probabilities given in the table. Find the expected value and variance for this probability distribution

Слайд 13


	     Calculation of variance of discrete random variable. 
                                      Car sales – example

Calculating the expected value:
E(x) = (0)(.15)+(1)(.3)+(2)(.2)+(3)(.2)+(4)(.1)+(5)(.05)= 1.95  rounded up to 2 (discrete random variable)
Calculating the expected variance:

  =
Описание слайда:
Calculation of variance of discrete random variable. Car sales – example Calculating the expected value: E(x) = (0)(.15)+(1)(.3)+(2)(.2)+(3)(.2)+(4)(.1)+(5)(.05)= 1.95 rounded up to 2 (discrete random variable) Calculating the expected variance: =

Слайд 14


		       Class exercise
A car dealer calculates the proportion of new cars sold that have been returned a various number of times for the correction of defects during the guarantee period. The results are as follows:
Graph the probability distribution function
Calculate the cumulative probability distribution 
What is the probability that cars will be returned for corrections more than two times? P(x > 2)
P(x < 2)?
Find the expected value of the number of a car for corrections for defects during the guarantee period
Find the expected variance
Описание слайда:
Class exercise A car dealer calculates the proportion of new cars sold that have been returned a various number of times for the correction of defects during the guarantee period. The results are as follows: Graph the probability distribution function Calculate the cumulative probability distribution What is the probability that cars will be returned for corrections more than two times? P(x > 2) P(x < 2)? Find the expected value of the number of a car for corrections for defects during the guarantee period Find the expected variance

Слайд 15


	    Dan’s computer Works – class exercise
The number of computers sold per day at Dan’s Computer Works is defined by the following probability distribution:
Calculate the expected value of number of computer sold per day:
Описание слайда:
Dan’s computer Works – class exercise The number of computers sold per day at Dan’s Computer Works is defined by the following probability distribution: Calculate the expected value of number of computer sold per day:

Слайд 16


	    Dan’s computer Works – class exercise
The number of computers sold per day at Dan’s Computer Works is defined by the following probability distribution:
Calculate the expected value of number of computer sold per day:
   E[x]= (0 x 0.05) + (1 x 0.1) + (2 x 0.2) + (3 x 0.2) + (4 x 0.2) + (5 x 0.15) + (6 x 0.1) = 3.25 rounded to 3
Описание слайда:
Dan’s computer Works – class exercise The number of computers sold per day at Dan’s Computer Works is defined by the following probability distribution: Calculate the expected value of number of computer sold per day: E[x]= (0 x 0.05) + (1 x 0.1) + (2 x 0.2) + (3 x 0.2) + (4 x 0.2) + (5 x 0.15) + (6 x 0.1) = 3.25 rounded to 3

Слайд 17


	   Dan’s computer Works – class exercise
The number of computers sold per day at Dan’s Computer Works is defined by the following probability distribution:
Calculate the variance of number of computer sold per day:
Описание слайда:
Dan’s computer Works – class exercise The number of computers sold per day at Dan’s Computer Works is defined by the following probability distribution: Calculate the variance of number of computer sold per day:

Слайд 18


	   Dan’s computer Works – class exercise
The number of computers sold per day at Dan’s Computer Works is defined by the following probability distribution:
Calculate the variance of number of computer sold per day:
=(0.05) +(0.1)+ + (0.2)+
      (0.2)+ (0.15) + (0.1) = 2.69
                                                     = 2.69
Описание слайда:
Dan’s computer Works – class exercise The number of computers sold per day at Dan’s Computer Works is defined by the following probability distribution: Calculate the variance of number of computer sold per day: =(0.05) +(0.1)+ + (0.2)+ (0.2)+ (0.15) + (0.1) = 2.69 = 2.69

Слайд 19


		     Quizz
A small school employs 5 teachers who make between $40,000 and $70,000 per year.
One of the 5 teachers, Valerie, decides to teach part-time which decreases her salary from $40,000 to $20,000 per year. The rest of the salaries stay the same.
How will decreasing Valerie's salary affect the mean and median?
Please choose from one of the following options:
A) Both the mean and median will decrease.
B) The mean will decrease, and the median will stay the same.
C)The median will decrease, and the mean will stay the same.
D) The mean will decrease, and the median will increase.
Описание слайда:
Quizz A small school employs 5 teachers who make between $40,000 and $70,000 per year. One of the 5 teachers, Valerie, decides to teach part-time which decreases her salary from $40,000 to $20,000 per year. The rest of the salaries stay the same. How will decreasing Valerie's salary affect the mean and median? Please choose from one of the following options: A) Both the mean and median will decrease. B) The mean will decrease, and the median will stay the same. C)The median will decrease, and the mean will stay the same. D) The mean will decrease, and the median will increase.

Слайд 20


      Khan Academy – Empirical Rule
A company produces batteries with a mean life time of 1’300 hours and a standard deviation of 50 hours. Use the Empirical rule (68 – 95 – 99.7 %) to estimate the probability of a battery to have a lifetime longer than 1’150 hours.  P (x > 1’150 hours)  
Which of the following is the right answer?
95 %
84%
73%
99.85%
Описание слайда:
Khan Academy – Empirical Rule A company produces batteries with a mean life time of 1’300 hours and a standard deviation of 50 hours. Use the Empirical rule (68 – 95 – 99.7 %) to estimate the probability of a battery to have a lifetime longer than 1’150 hours. P (x > 1’150 hours) Which of the following is the right answer? 95 % 84% 73% 99.85%

Слайд 21


Stating that two events are statistically independent means that the probability of one event occurring is independent of the probability of the other event having occurred.

TRUE
FALSE
Описание слайда:
Stating that two events are statistically independent means that the probability of one event occurring is independent of the probability of the other event having occurred. TRUE FALSE

Слайд 22


The time it takes a car to drive from Istanbul to Sinop is an example of a discrete random variable
True 
False
Описание слайда:
The time it takes a car to drive from Istanbul to Sinop is an example of a discrete random variable True False

Слайд 23


Probability is a numerical measure about the likelihood that an event will occur.

TRUE
FALSE
Описание слайда:
Probability is a numerical measure about the likelihood that an event will occur. TRUE FALSE

Слайд 24


Suppose that you enter a lottery by obtaining one of 20 tickets that have been distributed. By using the relative frequency  method, you can determine that the probability of your winning the lottery is 0.15.

TRUE
FALSE
Описание слайда:
Suppose that you enter a lottery by obtaining one of 20 tickets that have been distributed. By using the relative frequency method, you can determine that the probability of your winning the lottery is 0.15. TRUE FALSE

Слайд 25


If we flip a coin three times, the probability of getting three heads is 0.125.

TRUE
FALSE
Описание слайда:
If we flip a coin three times, the probability of getting three heads is 0.125. TRUE FALSE

Слайд 26


The number of products bought at a local store is an example of a discrete random variable.

TRUE
FALSE
Описание слайда:
The number of products bought at a local store is an example of a discrete random variable. TRUE FALSE

Слайд 27


       Empirical rule – Khan Academy
 a) Which shape does a distribution need to have to apply the Empirical Rule?
 b) The lifespans of zebras in a particular zoo are normally distributed. The average zebra lives 20.5 years, the standard deviation is 3.9, years.
Use the empirical rule (68-95-99.7%) to estimate the probability of a zebra living less than 32.2 years.
Описание слайда:
Empirical rule – Khan Academy a) Which shape does a distribution need to have to apply the Empirical Rule? b) The lifespans of zebras in a particular zoo are normally distributed. The average zebra lives 20.5 years, the standard deviation is 3.9, years. Use the empirical rule (68-95-99.7%) to estimate the probability of a zebra living less than 32.2 years.

Слайд 28


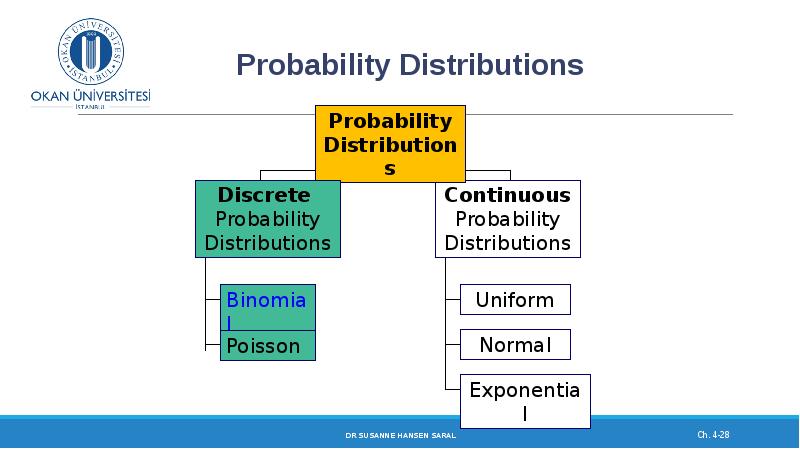
Discrete random variables – expected variance and standard deviation. Discrete Probability Distributions. Week 7 (1), слайд №28
Описание слайда:

Слайд 29


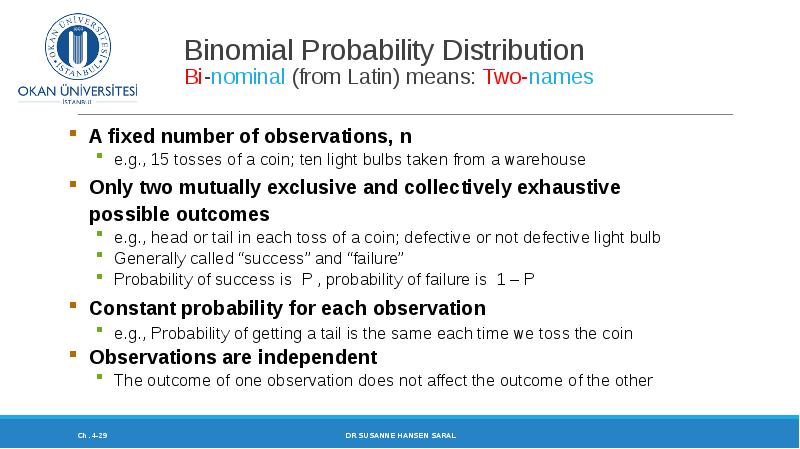
Binomial Probability Distribution
Bi-nominal (from Latin) means: Two-names
Описание слайда:
Binomial Probability Distribution Bi-nominal (from Latin) means: Two-names

Слайд 30


Possible Binomial Distribution 
examples
 A manufacturing plant labels products as either defective or acceptable
 A firm bidding for contracts will either get a contract or not
 A marketing research firm receives survey responses of “yes I will buy” or “no I
    will not”
 New job applicants either accept the offer or reject it
 A customer enters a store will either buy a product or will not buy a product
Описание слайда:
Possible Binomial Distribution examples A manufacturing plant labels products as either defective or acceptable A firm bidding for contracts will either get a contract or not A marketing research firm receives survey responses of “yes I will buy” or “no I will not” New job applicants either accept the offer or reject it A customer enters a store will either buy a product or will not buy a product

Слайд 31


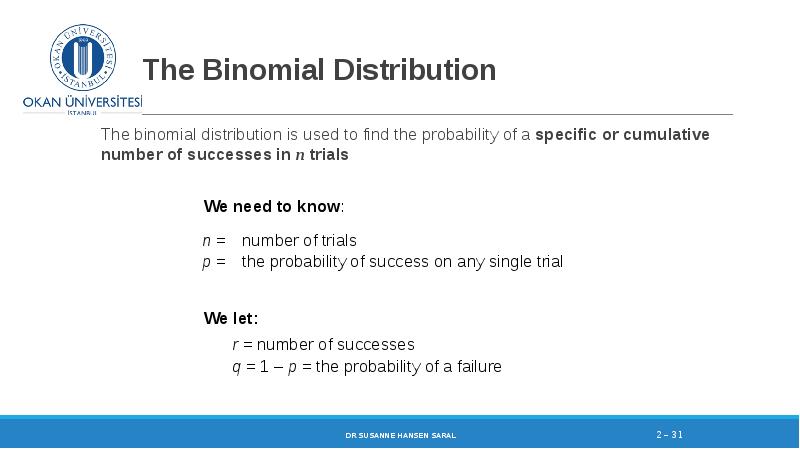
		The Binomial Distribution
The binomial distribution is used to find the probability of a specific or cumulative number of successes in n trials
Описание слайда:
The Binomial Distribution The binomial distribution is used to find the probability of a specific or cumulative number of successes in n trials

Слайд 32


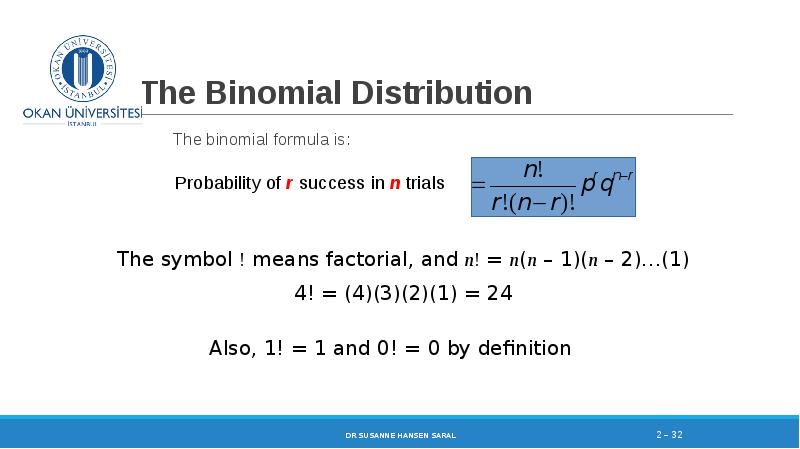
		The Binomial Distribution
The binomial formula is:
Описание слайда:
The Binomial Distribution The binomial formula is:

Слайд 33


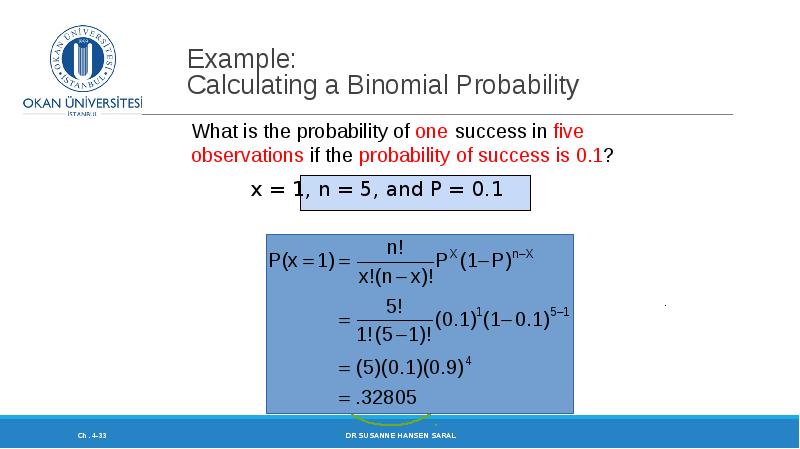
Example: 
Calculating a Binomial Probability
Описание слайда:
Example: Calculating a Binomial Probability

Слайд 34


          Binomial probability -
        Calculating binomial probabilities
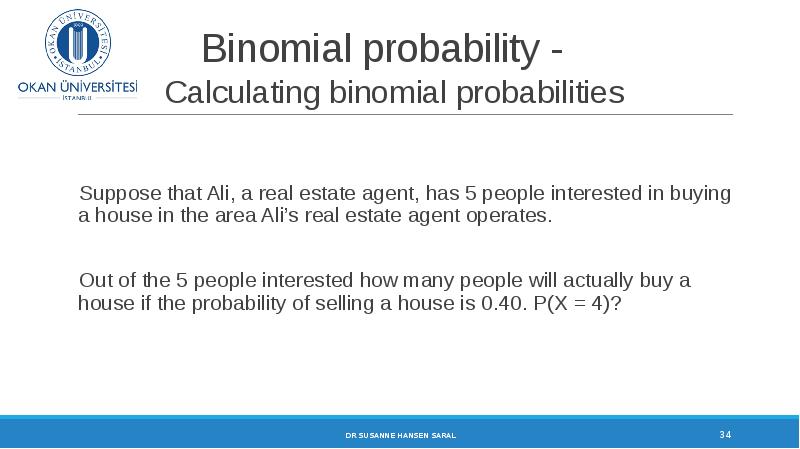
Suppose that Ali, a real estate agent, has 5 people interested in buying a house in the area Ali’s real estate agent operates. 
Out of the 5 people interested how many people will actually buy a house if the probability of selling a house is 0.40. P(X = 4)?
Описание слайда:
Binomial probability - Calculating binomial probabilities Suppose that Ali, a real estate agent, has 5 people interested in buying a house in the area Ali’s real estate agent operates. Out of the 5 people interested how many people will actually buy a house if the probability of selling a house is 0.40. P(X = 4)?

Слайд 35


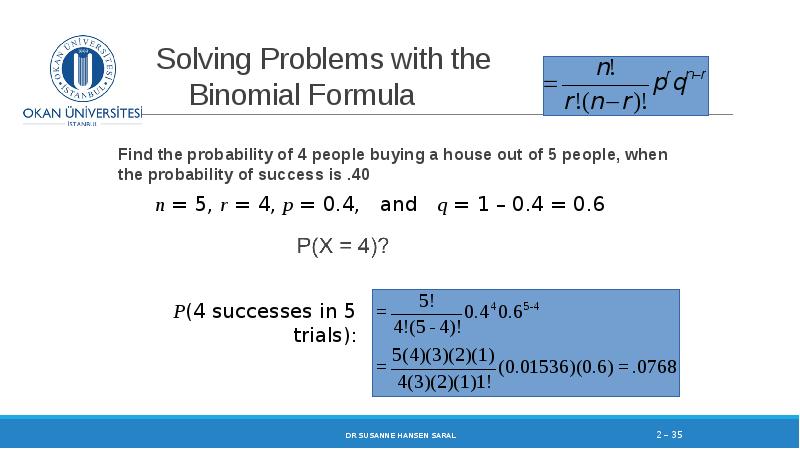
	      Solving Problems with the 
              Binomial Formula
Find the probability of 4 people buying a house out of 5 people, when the probability of success is .40
Описание слайда:
Solving Problems with the Binomial Formula Find the probability of 4 people buying a house out of 5 people, when the probability of success is .40

Слайд 36


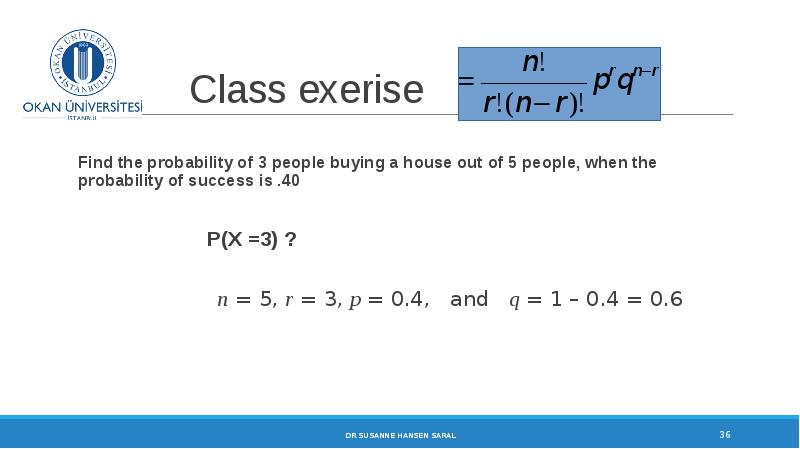
         Class exerise
Find the probability of 3 people buying a house out of 5 people, when the probability of success is .40 

     				  P(X =3) ?
                     n = 5, r = 3, p = 0.4,   and   q = 1 – 0.4 = 0.6
Описание слайда:
Class exerise Find the probability of 3 people buying a house out of 5 people, when the probability of success is .40 P(X =3) ? n = 5, r = 3, p = 0.4, and q = 1 – 0.4 = 0.6

Слайд 37


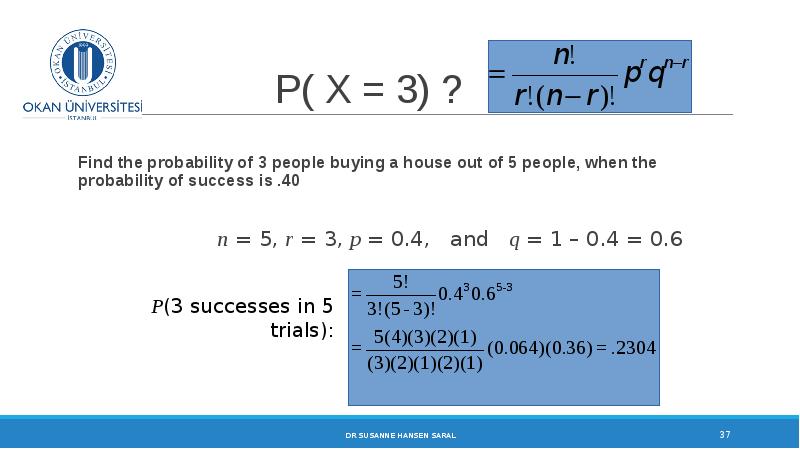
                P( X = 3) ? 
Find the probability of 3 people buying a house out of 5 people, when the probability of success is .40 
                     n = 5, r = 3, p = 0.4,   and   q = 1 – 0.4 = 0.6
Описание слайда:
P( X = 3) ? Find the probability of 3 people buying a house out of 5 people, when the probability of success is .40 n = 5, r = 3, p = 0.4, and q = 1 – 0.4 = 0.6

Слайд 38


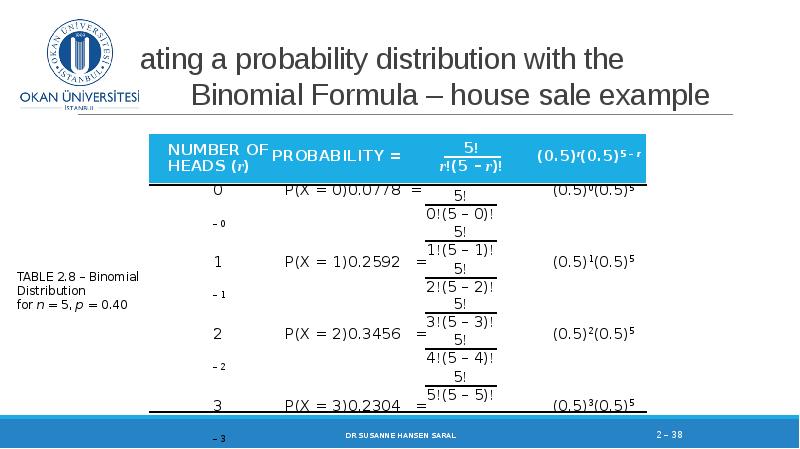
	   	Creating a probability distribution with the 
                    Binomial Formula – house sale example
Описание слайда:
Creating a probability distribution with the Binomial Formula – house sale example

Слайд 39


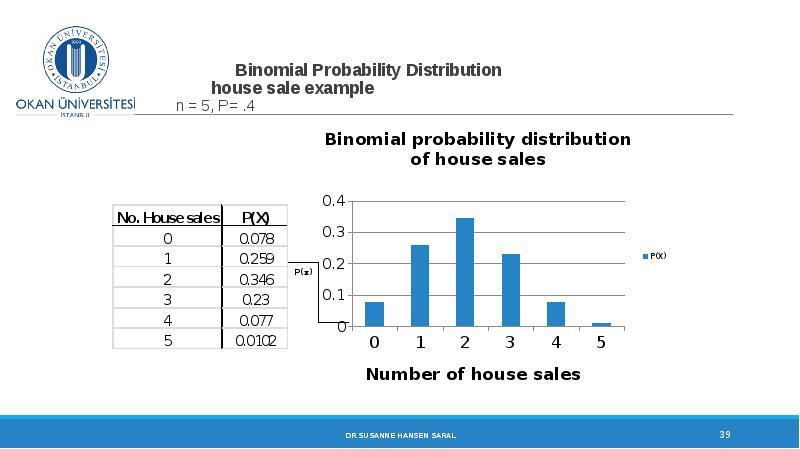
                   Binomial Probability Distribution
       		      house sale example
 			      n = 5, P= .4
Описание слайда:
Binomial Probability Distribution house sale example n = 5, P= .4

Слайд 40


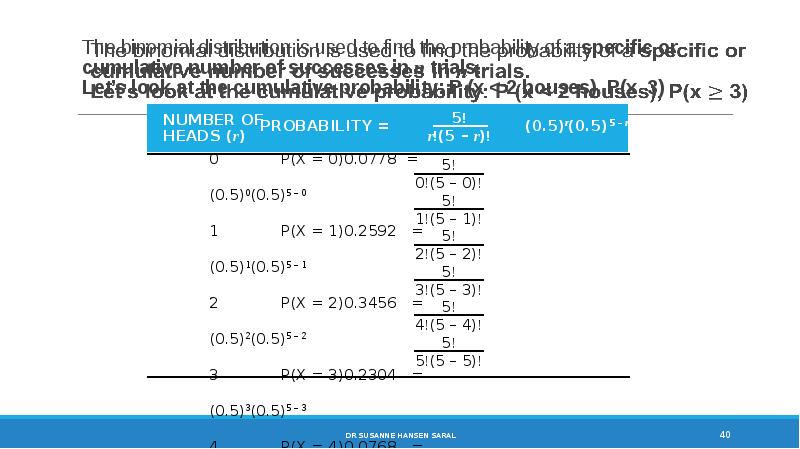
The binomial distribution is used to find the probability of a specific or cumulative number of successes in n trials.
Let’s look at the cumulative probability: P (x < 2 houses), P(x  3)
Описание слайда:
The binomial distribution is used to find the probability of a specific or cumulative number of successes in n trials. Let’s look at the cumulative probability: P (x < 2 houses), P(x 3)

Слайд 41


The binomial distribution is used to find the probability of a specific or cumulative number of successes in n trials.
Let’s look at the cumulative probability: P (x < 2 houses), P(x  3)

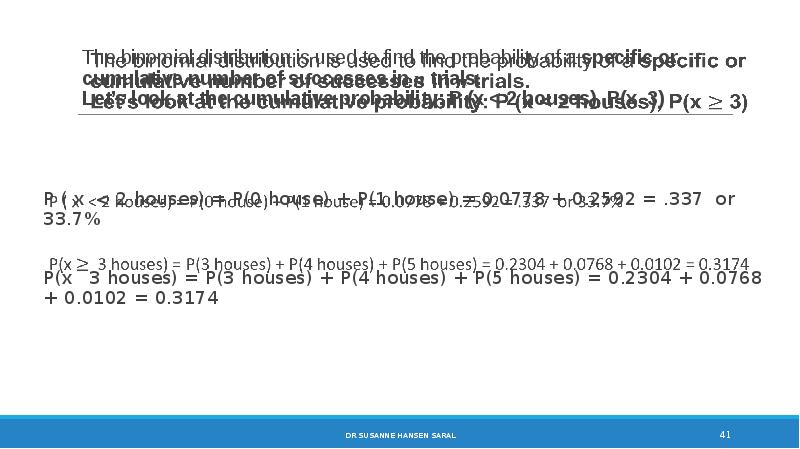
P ( x  < 2 houses) = P(0 house) + P(1 house) = 0.0778 + 0.2592 = .337  or 33.7%
P(x   3 houses) = P(3 houses) + P(4 houses) + P(5 houses) = 0.2304 + 0.0768 + 0.0102 = 0.3174
Описание слайда:
The binomial distribution is used to find the probability of a specific or cumulative number of successes in n trials. Let’s look at the cumulative probability: P (x < 2 houses), P(x 3) P ( x < 2 houses) = P(0 house) + P(1 house) = 0.0778 + 0.2592 = .337 or 33.7% P(x 3 houses) = P(3 houses) + P(4 houses) + P(5 houses) = 0.2304 + 0.0768 + 0.0102 = 0.3174

Слайд 42


Shape of Binomial Distribution
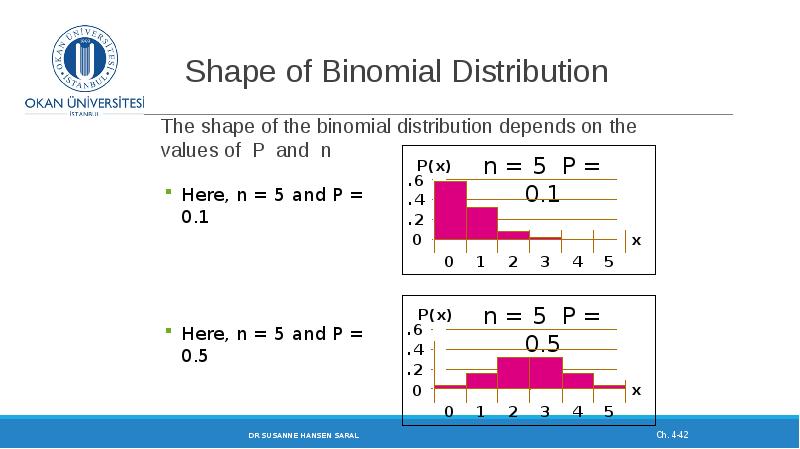
The shape of the binomial distribution depends on the values of  P  and  n
Описание слайда:
Shape of Binomial Distribution The shape of the binomial distribution depends on the values of P and n

Слайд 43


Binomial Distribution shapes 
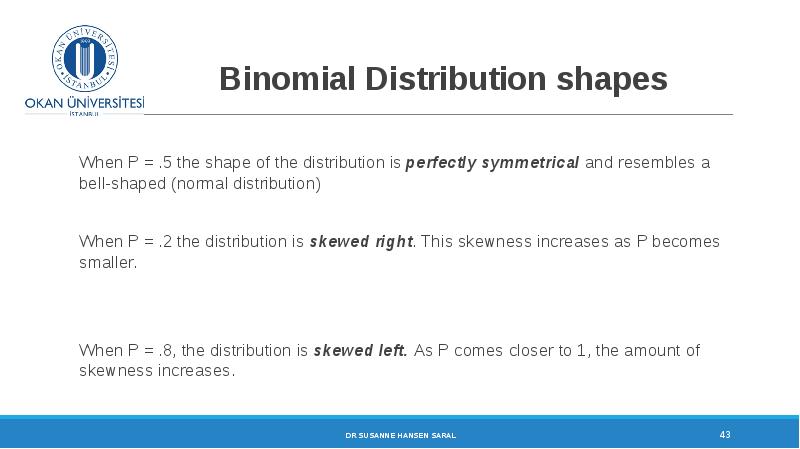
When P = .5 the shape of the distribution is perfectly symmetrical and resembles a bell-shaped (normal distribution)
When P = .2 the distribution is skewed right. This skewness increases as P becomes smaller.
When P = .8, the distribution is skewed left. As P comes closer to 1, the amount of skewness increases.
Описание слайда:
Binomial Distribution shapes When P = .5 the shape of the distribution is perfectly symmetrical and resembles a bell-shaped (normal distribution) When P = .2 the distribution is skewed right. This skewness increases as P becomes smaller. When P = .8, the distribution is skewed left. As P comes closer to 1, the amount of skewness increases.

Слайд 44


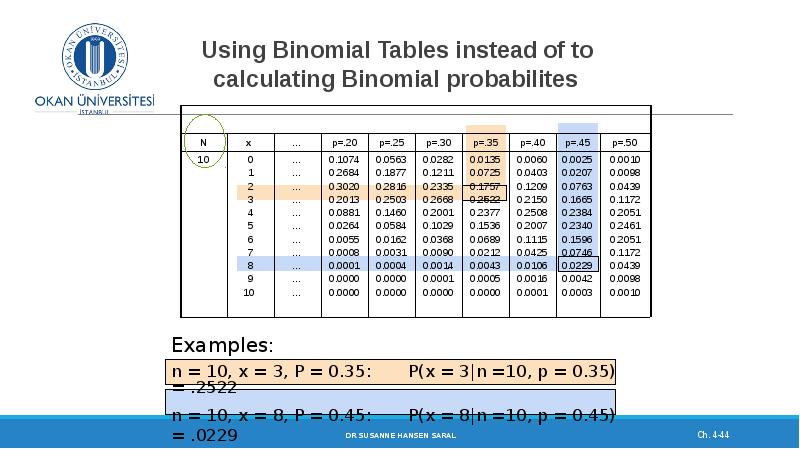
   Using Binomial Tables instead of to 
     calculating Binomial probabilites
Описание слайда:
Using Binomial Tables instead of to calculating Binomial probabilites

Слайд 45


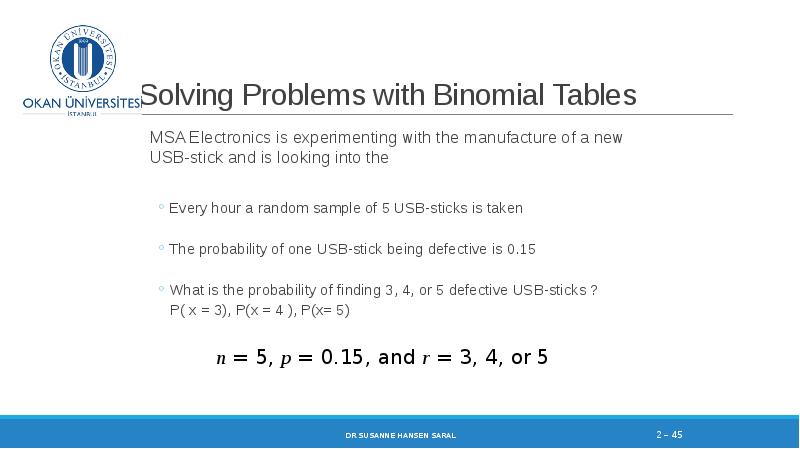
		Solving Problems with Binomial Tables
MSA Electronics is experimenting with the manufacture of a new USB-stick and is looking into the 
Every hour a random sample of 5 USB-sticks is taken
The probability of one USB-stick being defective is 0.15
What is the probability of finding 3, 4, or 5 defective USB-sticks ? 
   P( x = 3), P(x = 4 ), P(x= 5)
Описание слайда:
Solving Problems with Binomial Tables MSA Electronics is experimenting with the manufacture of a new USB-stick and is looking into the Every hour a random sample of 5 USB-sticks is taken The probability of one USB-stick being defective is 0.15 What is the probability of finding 3, 4, or 5 defective USB-sticks ? P( x = 3), P(x = 4 ), P(x= 5)

Слайд 46


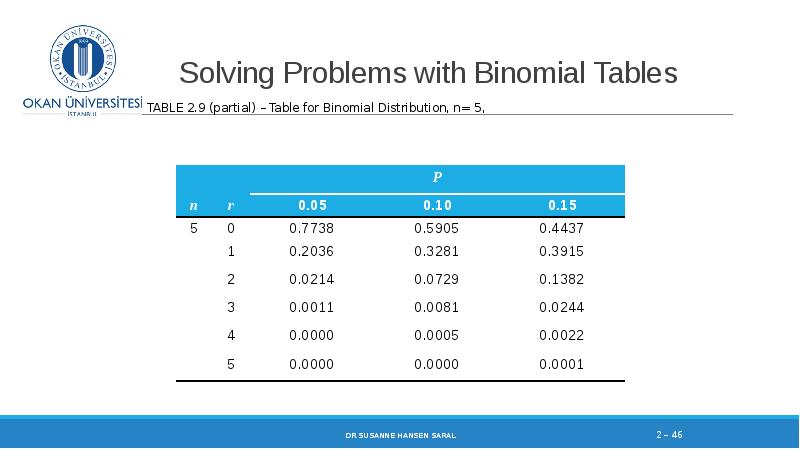
              Solving Problems with Binomial Tables
Описание слайда:
Solving Problems with Binomial Tables


Похожие презентации
Mypresentation.ru
Загрузить презентацию