🗊Презентация Displaying data – shape of distributions. Week 3 (1)

Категория: Математика
Нажмите для полного просмотра!
Displaying data – shape of distributions. Week 3 (1), слайд №1Displaying data – shape of distributions. Week 3 (1), слайд №2Displaying data – shape of distributions. Week 3 (1), слайд №3Displaying data – shape of distributions. Week 3 (1), слайд №4Displaying data – shape of distributions. Week 3 (1), слайд №5Displaying data – shape of distributions. Week 3 (1), слайд №6Displaying data – shape of distributions. Week 3 (1), слайд №7Displaying data – shape of distributions. Week 3 (1), слайд №8Displaying data – shape of distributions. Week 3 (1), слайд №9Displaying data – shape of distributions. Week 3 (1), слайд №10Displaying data – shape of distributions. Week 3 (1), слайд №11Displaying data – shape of distributions. Week 3 (1), слайд №12Displaying data – shape of distributions. Week 3 (1), слайд №13Displaying data – shape of distributions. Week 3 (1), слайд №14Displaying data – shape of distributions. Week 3 (1), слайд №15Displaying data – shape of distributions. Week 3 (1), слайд №16Displaying data – shape of distributions. Week 3 (1), слайд №17Displaying data – shape of distributions. Week 3 (1), слайд №18Displaying data – shape of distributions. Week 3 (1), слайд №19Displaying data – shape of distributions. Week 3 (1), слайд №20Displaying data – shape of distributions. Week 3 (1), слайд №21Displaying data – shape of distributions. Week 3 (1), слайд №22Displaying data – shape of distributions. Week 3 (1), слайд №23Displaying data – shape of distributions. Week 3 (1), слайд №24Displaying data – shape of distributions. Week 3 (1), слайд №25Displaying data – shape of distributions. Week 3 (1), слайд №26Displaying data – shape of distributions. Week 3 (1), слайд №27Displaying data – shape of distributions. Week 3 (1), слайд №28Displaying data – shape of distributions. Week 3 (1), слайд №29Displaying data – shape of distributions. Week 3 (1), слайд №30Displaying data – shape of distributions. Week 3 (1), слайд №31Displaying data – shape of distributions. Week 3 (1), слайд №32Displaying data – shape of distributions. Week 3 (1), слайд №33Displaying data – shape of distributions. Week 3 (1), слайд №34Displaying data – shape of distributions. Week 3 (1), слайд №35Displaying data – shape of distributions. Week 3 (1), слайд №36Displaying data – shape of distributions. Week 3 (1), слайд №37Displaying data – shape of distributions. Week 3 (1), слайд №38Displaying data – shape of distributions. Week 3 (1), слайд №39Displaying data – shape of distributions. Week 3 (1), слайд №40Displaying data – shape of distributions. Week 3 (1), слайд №41

Содержание

Вы можете ознакомиться и скачать презентацию на тему Displaying data – shape of distributions. Week 3 (1). Доклад-сообщение содержит 41 слайдов. Презентации для любого класса можно скачать бесплатно. Если материал и наш сайт презентаций Mypresentation Вам понравились – поделитесь им с друзьями с помощью социальных кнопок и добавьте в закладки в своем браузере.

Слайды и текст этой презентации


Слайд 1


BBA182 Applied Statistics
Week 3 (1) Displaying data – shape of distributions 
Dr Susanne Hansen Saral
Email: susanne.saral@okan.edu.tr
https://piazza.com/class/ixrj5mmox1u2t8?cid=4#
www.khanacademy.org
Описание слайда:
BBA182 Applied Statistics Week 3 (1) Displaying data – shape of distributions Dr Susanne Hansen Saral Email: susanne.saral@okan.edu.tr https://piazza.com/class/ixrj5mmox1u2t8?cid=4# www.khanacademy.org

Слайд 2


     Histogram of employee completion times  
  		       Numerical data
Описание слайда:
Histogram of employee completion times Numerical data

Слайд 3


              Numerical data 
     Employee completion time
            Cumulative frequency
Описание слайда:
Numerical data Employee completion time Cumulative frequency

Слайд 4


	Bar Chart – categorical data
Описание слайда:
Bar Chart – categorical data

Слайд 5


		          Describing distributions
Once we have made a picture of our numerical data, the histogram, what can we say about it’s shape?
Описание слайда:
Describing distributions Once we have made a picture of our numerical data, the histogram, what can we say about it’s shape?

Слайд 6


		Describing distributions – 
		what to pay attention to!
Pay attention to:
 its’ shape
 its’ center
 Its’ spread
Описание слайда:
Describing distributions – what to pay attention to! Pay attention to: its’ shape its’ center Its’ spread

Слайд 7


		Describing the shape of distributions
We describe the shape of a distribution in terms of:
 Modes
Symmetry
Gaps or outlying values
Описание слайда:
Describing the shape of distributions We describe the shape of a distribution in terms of: Modes Symmetry Gaps or outlying values

Слайд 8


                         		 Mode
Does the distribution have one peak (mode) or several peaks (several modes)?
Uni-modal: one mode
Bi-modal: Two modes
Multi-modal: More than two modes
Описание слайда:
Mode Does the distribution have one peak (mode) or several peaks (several modes)? Uni-modal: one mode Bi-modal: Two modes Multi-modal: More than two modes

Слайд 9


                         		Symmetry
If we can make a mirror image of the distribution, we have a symmetric distribution
Описание слайда:
Symmetry If we can make a mirror image of the distribution, we have a symmetric distribution

Слайд 10


			Skewed distribution
The thinner parts of a distribution are called tails. 
A distribution is skewed, or asymmetric, if one tail stretches farther out on one side than on the other side of the center.
A right skewed distribution has a tail that extends farther to the right.
A left skewed distribution has a tail that extends farther to the left.
Описание слайда:
Skewed distribution The thinner parts of a distribution are called tails. A distribution is skewed, or asymmetric, if one tail stretches farther out on one side than on the other side of the center. A right skewed distribution has a tail that extends farther to the right. A left skewed distribution has a tail that extends farther to the left.

Слайд 11


				Right skewed distributions
					      Examples
Employee salaries in a company
Waiting times in a line
Описание слайда:
Right skewed distributions Examples Employee salaries in a company Waiting times in a line

Слайд 12


				Left skewed distributions
					      Example
Time to finish an exam
Employees going home after work
Customers going shopping in a shopping center on a Saturday
Описание слайда:
Left skewed distributions Example Time to finish an exam Employees going home after work Customers going shopping in a shopping center on a Saturday

Слайд 13


                         		Outliers
Outliers are extreme data points in a data set that are not close to the majority of the other data points
Example:
Age of 10 people in a restaurant:
                        24     19     21     65    20     21     23     20   24      25
Описание слайда:
Outliers Outliers are extreme data points in a data set that are not close to the majority of the other data points Example: Age of 10 people in a restaurant: 24 19 21 65 20 21 23 20 24 25

Слайд 14


                         		Outliers
If you are studying the personal wealth of Americans in 2010 and you have Bill Gates (Founder of Microsoft) in your sample. 
How would the personal wealth of Bill Gates affect the distribution of personal wealth of Americans in the sample?
Описание слайда:
Outliers If you are studying the personal wealth of Americans in 2010 and you have Bill Gates (Founder of Microsoft) in your sample. How would the personal wealth of Bill Gates affect the distribution of personal wealth of Americans in the sample?

Слайд 15


                         		Outliers
Outliers will affect the shape of a distribution:
Описание слайда:
Outliers Outliers will affect the shape of a distribution:

Слайд 16


                         		Outliers
Outliers can affect almost every statistical method we use in Statistics.
Therefore we need to look out for them.
An outlier can be the most informative part in your data or it may just be an error. 
No matter what it is, you need to look at it critically and judge if it is important for our analysis.
Описание слайда:
Outliers Outliers can affect almost every statistical method we use in Statistics. Therefore we need to look out for them. An outlier can be the most informative part in your data or it may just be an error. No matter what it is, you need to look at it critically and judge if it is important for our analysis.

Слайд 17


		Graphs to Describe
 		   Time-Series Data
A histogram can provide information about the distribution of a variable, but it cannot show any pattern of the data over time.
Sometimes we need to analyze data over time. 
A graph of values against time is called a times series plot
Описание слайда:
Graphs to Describe Time-Series Data A histogram can provide information about the distribution of a variable, but it cannot show any pattern of the data over time. Sometimes we need to analyze data over time. A graph of values against time is called a times series plot

Слайд 18


		Graphs to Describe
 		   Time-Series Data
A time-series plot is used to show the values of a variable ordered over time. 

Time is measured on the horizontal axis
The variable of interest is measured on the vertical axis
Used to monitor the evolution of a certain item of interest, such as evolution of the price of gas, annual interest rates, daily closing prices for shares of common stock, evolution of home prices in a certain region, exchange rates (Euro-TL, TL-$), etc.
Описание слайда:
Graphs to Describe Time-Series Data A time-series plot is used to show the values of a variable ordered over time. Time is measured on the horizontal axis The variable of interest is measured on the vertical axis Used to monitor the evolution of a certain item of interest, such as evolution of the price of gas, annual interest rates, daily closing prices for shares of common stock, evolution of home prices in a certain region, exchange rates (Euro-TL, TL-$), etc.

Слайд 19


	  Line Chart (time series plot) 			One variable
Описание слайда:
Line Chart (time series plot) One variable

Слайд 20


		       Line Chart (time series plot)
			           Two variables
Описание слайда:
Line Chart (time series plot) Two variables

Слайд 21


		      Line Chart (time series plot)
			              Two variables
Описание слайда:
Line Chart (time series plot) Two variables

Слайд 22


	Presenting statistical charts and graphs
When presenting data for an audience or a manager your charts and graphs MUST give as clear and accurate picture of  the  data as possible.
The graphs and charts must be:
 Convincing
 Clear
 Truthful
Описание слайда:
Presenting statistical charts and graphs When presenting data for an audience or a manager your charts and graphs MUST give as clear and accurate picture of the data as possible. The graphs and charts must be: Convincing Clear Truthful

Слайд 23


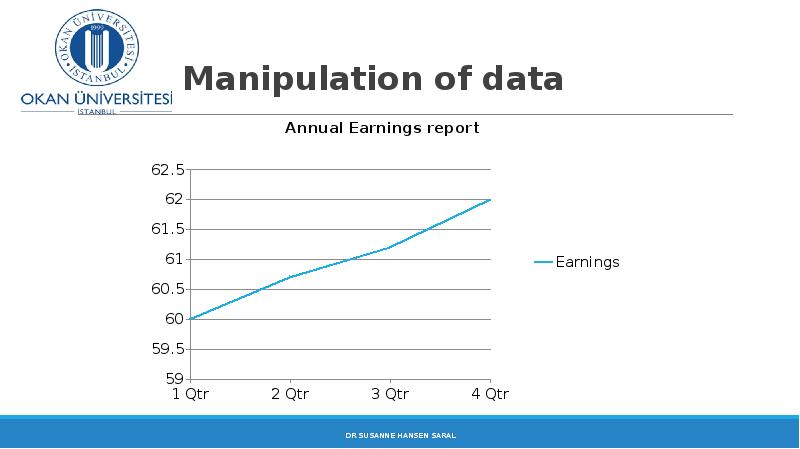
			Manipulation of data
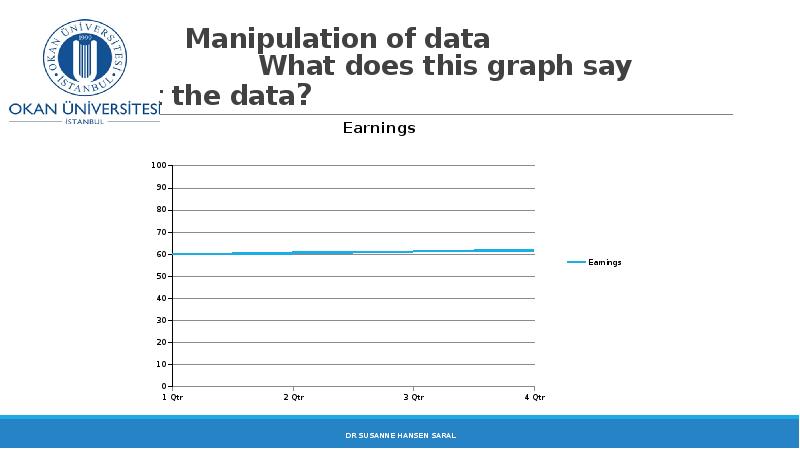
Data can be manipulated in graphical techniques in such a way that they look more/less favorable than they are in reality. This gives misleading information about the data.
You need to be critical whenever you are presented a graph, pie-chart, histogram, etc.
You should also be careful not to construct misleading information with graphical techniques.
Описание слайда:
Manipulation of data Data can be manipulated in graphical techniques in such a way that they look more/less favorable than they are in reality. This gives misleading information about the data. You need to be critical whenever you are presented a graph, pie-chart, histogram, etc. You should also be careful not to construct misleading information with graphical techniques.

Слайд 24


		               Manipulation of data
Описание слайда:
Manipulation of data

Слайд 25


		Identical data - different graph
		         How is this possible?
Описание слайда:
Identical data - different graph How is this possible?

Слайд 26


       	             Manipulation of data
Описание слайда:
Manipulation of data

Слайд 27


			Manipulation of data
Описание слайда:
Manipulation of data

Слайд 28


			  Manipulation of data
                  	What does this graph say about the data?
Описание слайда:
Manipulation of data What does this graph say about the data?

Слайд 29


       	         Manipulation of data
Описание слайда:
Manipulation of data

Слайд 30


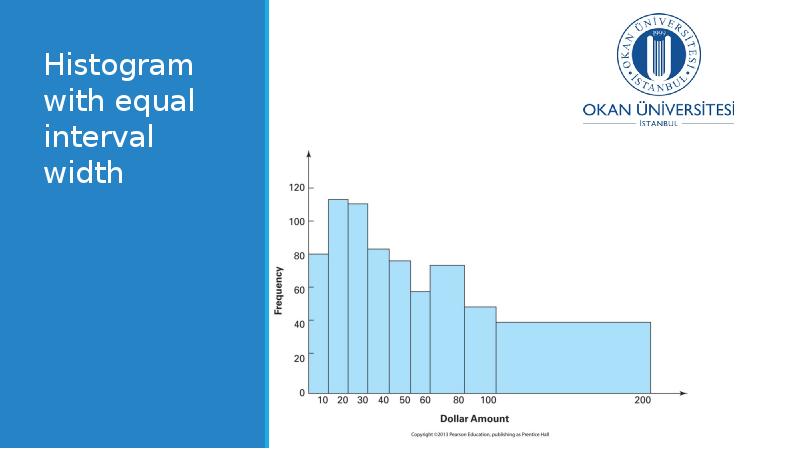
Histogram with equal interval width
Описание слайда:
Histogram with equal interval width

Слайд 31


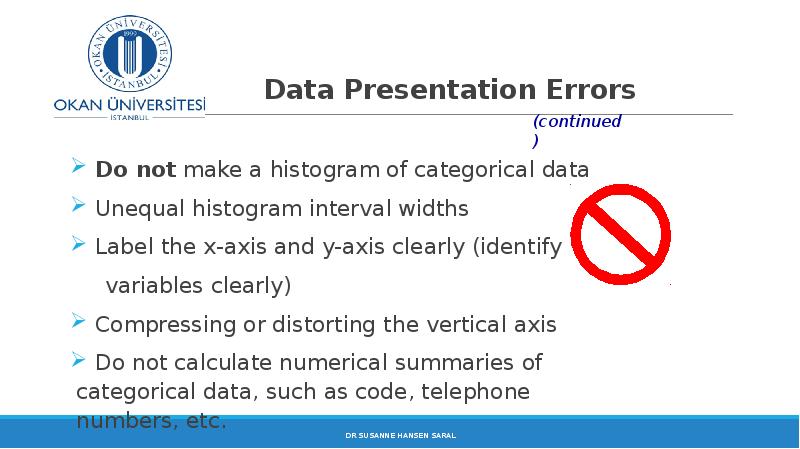
            Data Presentation Errors
 Do not make a histogram of categorical data
 Unequal histogram interval widths
 Label the x-axis and y-axis clearly (identify
     variables clearly)
 Compressing or distorting the vertical axis
 Do not calculate numerical summaries of categorical data, such as code, telephone numbers, etc.
Описание слайда:
Data Presentation Errors Do not make a histogram of categorical data Unequal histogram interval widths Label the x-axis and y-axis clearly (identify variables clearly) Compressing or distorting the vertical axis Do not calculate numerical summaries of categorical data, such as code, telephone numbers, etc.

Слайд 32


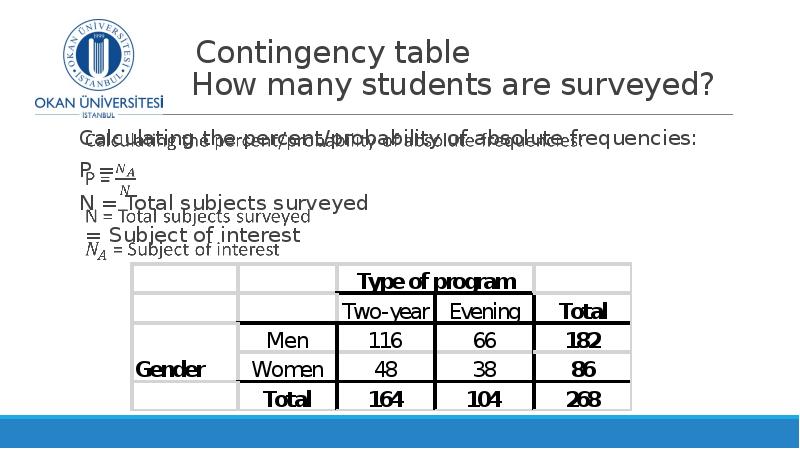
		      Contingency table
                      Class exercise
A survey of the entering MBA students at a university in the US reported the following data on the gender of their students in their two MBA programs:
What are the two variables under study?
Описание слайда:
Contingency table Class exercise A survey of the entering MBA students at a university in the US reported the following data on the gender of their students in their two MBA programs: What are the two variables under study?

Слайд 33


		          Contingency table
            How many students are surveyed?
A) How many of all MBA students are women?
B) How many of Two-year MBAs are women?
C) How many of Evening MBAs are men?
D) How many of all MBAs are men?
Описание слайда:
Contingency table How many students are surveyed? A) How many of all MBA students are women? B) How many of Two-year MBAs are women? C) How many of Evening MBAs are men? D) How many of all MBAs are men?

Слайд 34


		          Contingency table
            How many students are surveyed?
Calculating the percent/probability of absolute frequencies:
P = 
N = Total subjects surveyed
 = Subject of interest
Описание слайда:
Contingency table How many students are surveyed? Calculating the percent/probability of absolute frequencies: P = N = Total subjects surveyed = Subject of interest

Слайд 35


		Contingency table in percent
A) What percent of all MBA students are women?
B) What percent of Two-year MBAs are women?
C) What percent of Evening MBAs are men?
D) What percent of all MBAs are men?
Описание слайда:
Contingency table in percent A) What percent of all MBA students are women? B) What percent of Two-year MBAs are women? C) What percent of Evening MBAs are men? D) What percent of all MBAs are men?

Слайд 36


		      Contingency table
A) What percent of all MBA students are women?
B) What percent of Two-year MBAs are women?
C) What percent of Evening MBAs are men?
D) What percent of all MBAs are men?
Описание слайда:
Contingency table A) What percent of all MBA students are women? B) What percent of Two-year MBAs are women? C) What percent of Evening MBAs are men? D) What percent of all MBAs are men?

Слайд 37


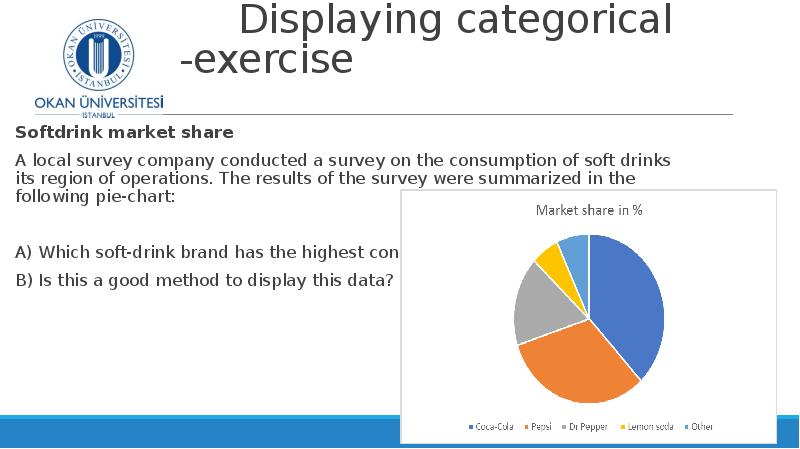
             Displaying categorical data -exercise
Softdrink market share
A local survey company conducted a survey on the consumption of soft drinks its region of operations. The results of the survey were summarized in the following pie-chart:
A) Which soft-drink brand has the highest consumption?
B) Is this a good method to display this data?
Описание слайда:
Displaying categorical data -exercise Softdrink market share A local survey company conducted a survey on the consumption of soft drinks its region of operations. The results of the survey were summarized in the following pie-chart: A) Which soft-drink brand has the highest consumption? B) Is this a good method to display this data?

Слайд 38


             Displaying categorical data -exercise
Softdrink market share ( same data as in the preceding slide)
A local survey company conducted a survey on the consumption of soft drinks its region of operations. The results of the survey were summarized in the following pie-chart:
A) Compared to the pie chart in the preceding slide, which
     chart is better for displaying the relative proportion (per-
     cent) of market share
B) Which chart gives the best visual picture of the data?
Описание слайда:
Displaying categorical data -exercise Softdrink market share ( same data as in the preceding slide) A local survey company conducted a survey on the consumption of soft drinks its region of operations. The results of the survey were summarized in the following pie-chart: A) Compared to the pie chart in the preceding slide, which chart is better for displaying the relative proportion (per- cent) of market share B) Which chart gives the best visual picture of the data?

Слайд 39


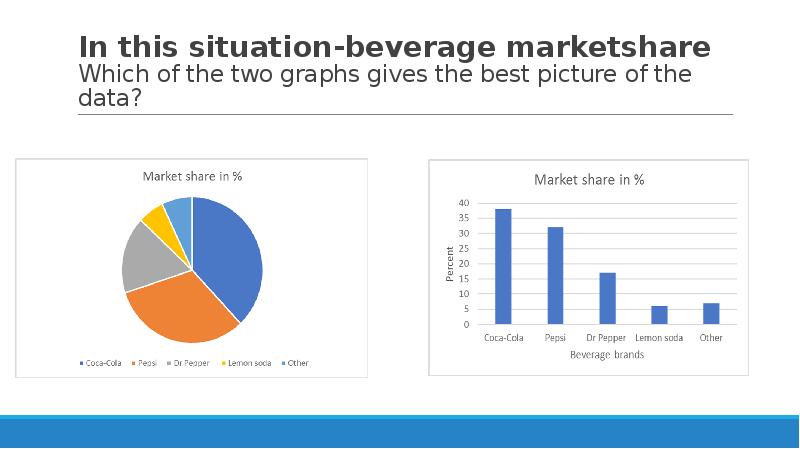
In this situation-beverage marketshare
Which of the two graphs gives the best picture of the data?
Описание слайда:
In this situation-beverage marketshare Which of the two graphs gives the best picture of the data?

Слайд 40


               Are there any outliers in the 
                      following data sets?
If yes, explain:
A)   15    21   20    54   18    17    22   22
B) 345     340      339      344      338      341     343
C) – 21     -23    -25   -18    -20    -63    -19   -22
Описание слайда:
Are there any outliers in the following data sets? If yes, explain: A) 15 21 20 54 18 17 22 22 B) 345 340 339 344 338 341 343 C) – 21 -23 -25 -18 -20 -63 -19 -22

Слайд 41


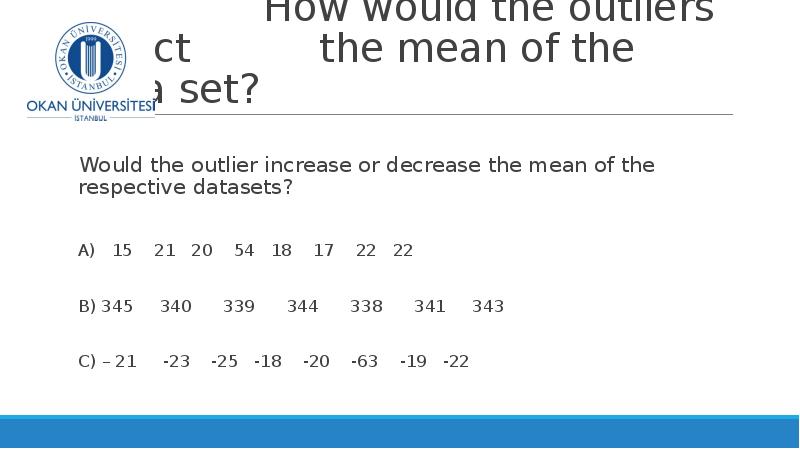
               How would the outliers affect   		     the mean of the data set?
Would the outlier increase or decrease the mean of the respective datasets?
A)   15    21   20    54   18    17    22   22
B) 345     340      339      344      338      341     343
C) – 21     -23    -25   -18    -20    -63    -19   -22
Описание слайда:
How would the outliers affect the mean of the data set? Would the outlier increase or decrease the mean of the respective datasets? A) 15 21 20 54 18 17 22 22 B) 345 340 339 344 338 341 343 C) – 21 -23 -25 -18 -20 -63 -19 -22


Похожие презентации
Mypresentation.ru
Загрузить презентацию