🗊Презентация Getting your data: Sources and samples

Категория: Математика
Нажмите для полного просмотра!
Getting your data: Sources and samples, слайд №1Getting your data: Sources and samples, слайд №2Getting your data: Sources and samples, слайд №3Getting your data: Sources and samples, слайд №4Getting your data: Sources and samples, слайд №5Getting your data: Sources and samples, слайд №6Getting your data: Sources and samples, слайд №7Getting your data: Sources and samples, слайд №8Getting your data: Sources and samples, слайд №9Getting your data: Sources and samples, слайд №10Getting your data: Sources and samples, слайд №11Getting your data: Sources and samples, слайд №12Getting your data: Sources and samples, слайд №13Getting your data: Sources and samples, слайд №14Getting your data: Sources and samples, слайд №15Getting your data: Sources and samples, слайд №16Getting your data: Sources and samples, слайд №17Getting your data: Sources and samples, слайд №18Getting your data: Sources and samples, слайд №19Getting your data: Sources and samples, слайд №20Getting your data: Sources and samples, слайд №21Getting your data: Sources and samples, слайд №22Getting your data: Sources and samples, слайд №23Getting your data: Sources and samples, слайд №24Getting your data: Sources and samples, слайд №25Getting your data: Sources and samples, слайд №26Getting your data: Sources and samples, слайд №27Getting your data: Sources and samples, слайд №28Getting your data: Sources and samples, слайд №29Getting your data: Sources and samples, слайд №30Getting your data: Sources and samples, слайд №31

Вы можете ознакомиться и скачать презентацию на тему Getting your data: Sources and samples. Доклад-сообщение содержит 31 слайдов. Презентации для любого класса можно скачать бесплатно. Если материал и наш сайт презентаций Mypresentation Вам понравились – поделитесь им с друзьями с помощью социальных кнопок и добавьте в закладки в своем браузере.

Слайды и текст этой презентации


Слайд 1


Getting your data: Sources and samples
Описание слайда:
Getting your data: Sources and samples

Слайд 2


Sources of psychological data 
and Data collection methods
Data sources
Описание слайда:
Sources of psychological data and Data collection methods Data sources

Слайд 3


Why experiment is not a method of data collection?
Описание слайда:
Why experiment is not a method of data collection?

Слайд 4


Data collection exercise - 15 mins - 
In groups of 4 think of a Research Question/ Hypothesis
What type of data is the most suitable for your RQ or H?
What data collection method is the most suitable?
WHY?
Описание слайда:
Data collection exercise - 15 mins - In groups of 4 think of a Research Question/ Hypothesis What type of data is the most suitable for your RQ or H? What data collection method is the most suitable? WHY?

Слайд 5


Sample
Описание слайда:
Sample

Слайд 6


Sample and distribution
What is distribution?
Описание слайда:
Sample and distribution What is distribution?

Слайд 7


Descriptive statistics…
Описание слайда:
Descriptive statistics…

Слайд 8


Exercise
A survey of 20 students was conducted to find out how many books they had read during the past three months (including books for school). The results from those 20 students are shown below. Find the mean, median, and mode for this data.
2, 4, 5, 1, 3, 2, 5, 6, 1, 2, 4, 3, 6, 10, 12, 10, 2, 8, 6, 7
Answers:
Mean  = 4.95. 
Median  = 4.5
Mode  = 2.
Описание слайда:
Exercise A survey of 20 students was conducted to find out how many books they had read during the past three months (including books for school). The results from those 20 students are shown below. Find the mean, median, and mode for this data. 2, 4, 5, 1, 3, 2, 5, 6, 1, 2, 4, 3, 6, 10, 12, 10, 2, 8, 6, 7 Answers: Mean = 4.95. Median = 4.5 Mode = 2.

Слайд 9


Normal distribution
Properties of any theoretical normal distribution:
1) The curve never approaches horizontal axis.
2) Symmetrical around the mean.
3) Skewness = 0 and kurtosis = 0.
Standard normal distribution is a special case of theoretical n.d. with 2 properties: 
1)  = 0,  = 1; 
2) area under the curve = 1, and integral of  (-∞; z] can be interpreted as probability of finding values equal to or below Z.
Описание слайда:
Normal distribution Properties of any theoretical normal distribution: 1) The curve never approaches horizontal axis. 2) Symmetrical around the mean. 3) Skewness = 0 and kurtosis = 0. Standard normal distribution is a special case of theoretical n.d. with 2 properties: 1)  = 0,  = 1; 2) area under the curve = 1, and integral of (-∞; z] can be interpreted as probability of finding values equal to or below Z.

Слайд 10


Normal distribution
Описание слайда:
Normal distribution

Слайд 11


Where is NORMAL distribution?
Описание слайда:
Where is NORMAL distribution?

Слайд 12


What do we know about STANDARD normal distribution?
1) The curve never approaches horizontal axis
2) Symmetrical around the mean
3) Skewness = 0 and kurtosis = 0
4) Mean = 0, SD = 1
5) Mean= mode= median =0
Описание слайда:
What do we know about STANDARD normal distribution? 1) The curve never approaches horizontal axis 2) Symmetrical around the mean 3) Skewness = 0 and kurtosis = 0 4) Mean = 0, SD = 1 5) Mean= mode= median =0

Слайд 13


Why is it important to know what kind of distribution your variables have?
Описание слайда:
Why is it important to know what kind of distribution your variables have?

Слайд 14


Descriptive statistics…
Описание слайда:
Descriptive statistics…

Слайд 15


 Are you tall?
Описание слайда:
Are you tall?

Слайд 16


When you know so much about distributions, you can compute a height distribution in your group
Описание слайда:
When you know so much about distributions, you can compute a height distribution in your group

Слайд 17


When you know Mean and SD, you can estimate whether you are tall or not
Описание слайда:
When you know Mean and SD, you can estimate whether you are tall or not

Слайд 18


Is this result applicable in other groups?

Are you tall in other groups?

In HSE?

In Russia?

To answer this question we should use standard scores
Описание слайда:
Is this result applicable in other groups? Are you tall in other groups? In HSE? In Russia? To answer this question we should use standard scores

Слайд 19


Standard scores (Z-scores)
Описание слайда:
Standard scores (Z-scores)

Слайд 20


Standard normal table
Shows you a PROBABILITY that all observed values in your sample  are lower than Z
Описание слайда:
Standard normal table Shows you a PROBABILITY that all observed values in your sample are lower than Z

Слайд 21


What is the probability to find people taller than you in…
…Guatemala?
Mean =  147.3 cm
SD = 6.3 
your Z = (your cm - 147.3)/ 6.3 
Then look in Z-table
Описание слайда:
What is the probability to find people taller than you in… …Guatemala? Mean = 147.3 cm SD = 6.3 your Z = (your cm - 147.3)/ 6.3 Then look in Z-table

Слайд 22


Getting your data: Sources and samples, слайд №22
Описание слайда:

Слайд 23


Sample size and standard error
We know M and SD in your group
And we know M and SD in Guatemala
Описание слайда:
Sample size and standard error We know M and SD in your group And we know M and SD in Guatemala

Слайд 24


Getting your data: Sources and samples, слайд №24
Описание слайда:

Слайд 25


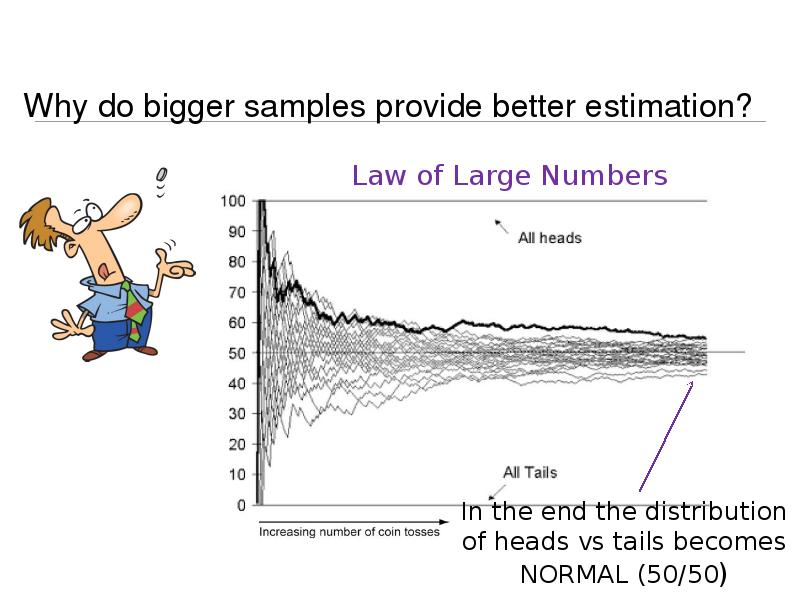
Why do bigger samples provide better estimation?
Описание слайда:
Why do bigger samples provide better estimation?

Слайд 26


Sampling strategies
Probability strategy
Описание слайда:
Sampling strategies Probability strategy

Слайд 27


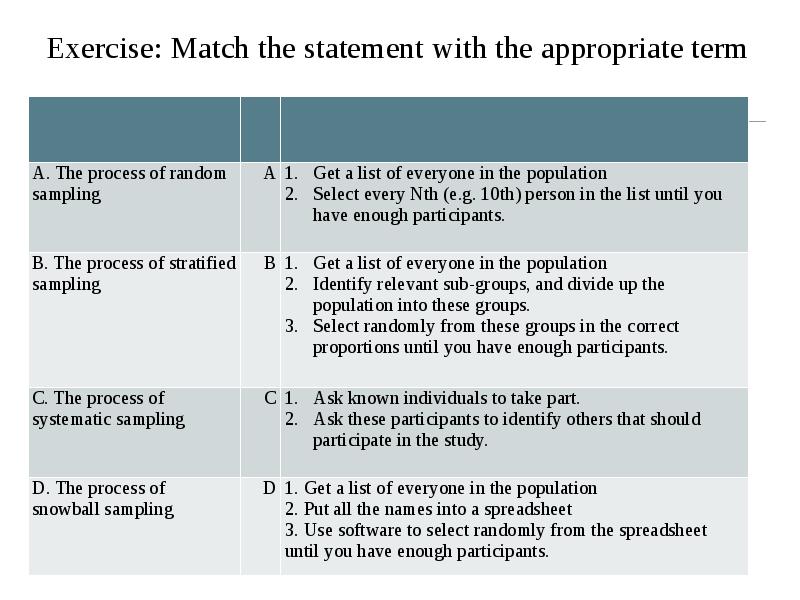
Exercise: Match the statement with the appropriate term
Описание слайда:
Exercise: Match the statement with the appropriate term

Слайд 28


I want to study cultural differences…/ I want to study how culture influence…
This is possible only with  representative samples collected in few countries!!!!
A non-representative or a sample from 1 country only cannot help you with this kind of RQ
Open access data: 
European Social Survey  http://www.europeansocialsurvey.org/
World Values Survey http://www.worldvaluessurvey.org/wvs.jsp 
 European Values Survey http://www.europeanvaluesstudy.eu/
Описание слайда:
I want to study cultural differences…/ I want to study how culture influence… This is possible only with representative samples collected in few countries!!!! A non-representative or a sample from 1 country only cannot help you with this kind of RQ Open access data: European Social Survey http://www.europeansocialsurvey.org/ World Values Survey http://www.worldvaluessurvey.org/wvs.jsp European Values Survey http://www.europeanvaluesstudy.eu/

Слайд 29


Recommended reading:
Howitt & Cramer, 2011, p. 232-246 (Samples).
Supplementary reading:
Bakeman, 2000 (Chapter 7 in Reis & Judd, 2000) 	(Observation)

Cramer, 2007 (in Robins, Fraley, Krueger, 2007) 	(Archival method)

Diamond & Otter-Henderson, 2007 (in Robins, 	Fraley, Krueger, 2007) (Physiological measures)

Fraley, 2007 (in Robins, Fraley, Krueger, 2007) 	(Internet studies)

Wilkinson, Joffe, & Yardley, 2004 (Interviews and focus groups)
Описание слайда:
Recommended reading: Howitt & Cramer, 2011, p. 232-246 (Samples). Supplementary reading: Bakeman, 2000 (Chapter 7 in Reis & Judd, 2000) (Observation) Cramer, 2007 (in Robins, Fraley, Krueger, 2007) (Archival method) Diamond & Otter-Henderson, 2007 (in Robins, Fraley, Krueger, 2007) (Physiological measures) Fraley, 2007 (in Robins, Fraley, Krueger, 2007) (Internet studies) Wilkinson, Joffe, & Yardley, 2004 (Interviews and focus groups)

Слайд 30


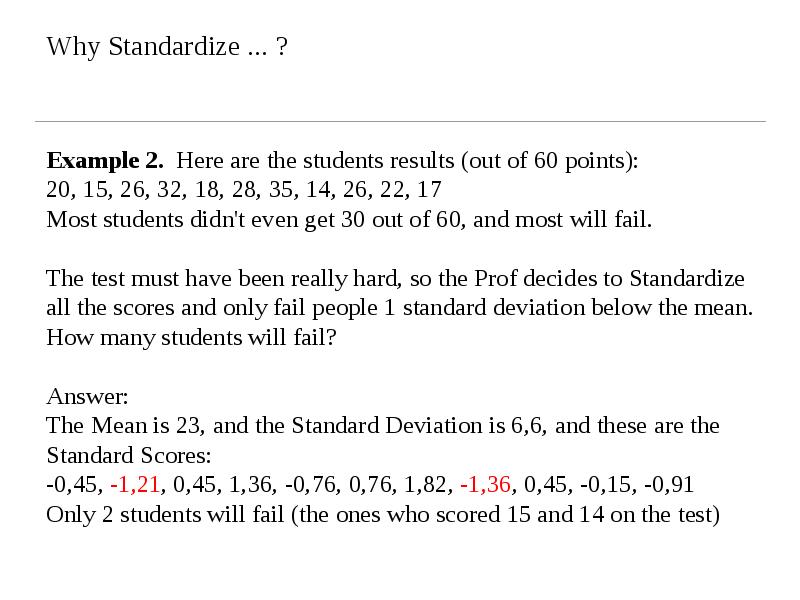
Why Standardize ... ?
Example 2.  Here are the students results (out of 60 points):
20, 15, 26, 32, 18, 28, 35, 14, 26, 22, 17
Most students didn't even get 30 out of 60, and most will fail.
The test must have been really hard, so the Prof decides to Standardize all the scores and only fail people 1 standard deviation below the mean.
How many students will fail? 
Answer:
The Mean is 23, and the Standard Deviation is 6,6, and these are the Standard Scores:
-0,45, -1,21, 0,45, 1,36, -0,76, 0,76, 1,82, -1,36, 0,45, -0,15, -0,91
Only 2 students will fail (the ones who scored 15 and 14 on the test)
Описание слайда:
Why Standardize ... ? Example 2. Here are the students results (out of 60 points): 20, 15, 26, 32, 18, 28, 35, 14, 26, 22, 17 Most students didn't even get 30 out of 60, and most will fail. The test must have been really hard, so the Prof decides to Standardize all the scores and only fail people 1 standard deviation below the mean. How many students will fail? Answer: The Mean is 23, and the Standard Deviation is 6,6, and these are the Standard Scores: -0,45, -1,21, 0,45, 1,36, -0,76, 0,76, 1,82, -1,36, 0,45, -0,15, -0,91 Only 2 students will fail (the ones who scored 15 and 14 on the test)

Слайд 31


Next time
Psychological measurement: Psychometrics and psychophysics
Описание слайда:
Next time Psychological measurement: Psychometrics and psychophysics


Похожие презентации
Mypresentation.ru
Загрузить презентацию