🗊 Презентация Introduction to Statistics. Week 1 (2)

Категория: Математика
Нажмите для полного просмотра!
Introduction to Statistics. Week 1 (2), слайд №1 Introduction to Statistics. Week 1 (2), слайд №2 Introduction to Statistics. Week 1 (2), слайд №3 Introduction to Statistics. Week 1 (2), слайд №4 Introduction to Statistics. Week 1 (2), слайд №5 Introduction to Statistics. Week 1 (2), слайд №6 Introduction to Statistics. Week 1 (2), слайд №7 Introduction to Statistics. Week 1 (2), слайд №8 Introduction to Statistics. Week 1 (2), слайд №9 Introduction to Statistics. Week 1 (2), слайд №10 Introduction to Statistics. Week 1 (2), слайд №11 Introduction to Statistics. Week 1 (2), слайд №12 Introduction to Statistics. Week 1 (2), слайд №13 Introduction to Statistics. Week 1 (2), слайд №14 Introduction to Statistics. Week 1 (2), слайд №15 Introduction to Statistics. Week 1 (2), слайд №16 Introduction to Statistics. Week 1 (2), слайд №17 Introduction to Statistics. Week 1 (2), слайд №18 Introduction to Statistics. Week 1 (2), слайд №19 Introduction to Statistics. Week 1 (2), слайд №20 Introduction to Statistics. Week 1 (2), слайд №21 Introduction to Statistics. Week 1 (2), слайд №22

Вы можете ознакомиться и скачать презентацию на тему Introduction to Statistics. Week 1 (2). Доклад-сообщение содержит 22 слайдов. Презентации для любого класса можно скачать бесплатно. Если материал и наш сайт презентаций Mypresentation Вам понравились – поделитесь им с друзьями с помощью социальных кнопок и добавьте в закладки в своем браузере.

Слайды и текст этой презентации


Слайд 1


BBA182 Applied Statistics Week 1 (2) Introduction to Statistics Dr Susanne Hansen Saral Email: susanne.saral@okan.edu.tr
Описание слайда:
BBA182 Applied Statistics Week 1 (2) Introduction to Statistics Dr Susanne Hansen Saral Email: susanne.saral@okan.edu.tr

Слайд 2


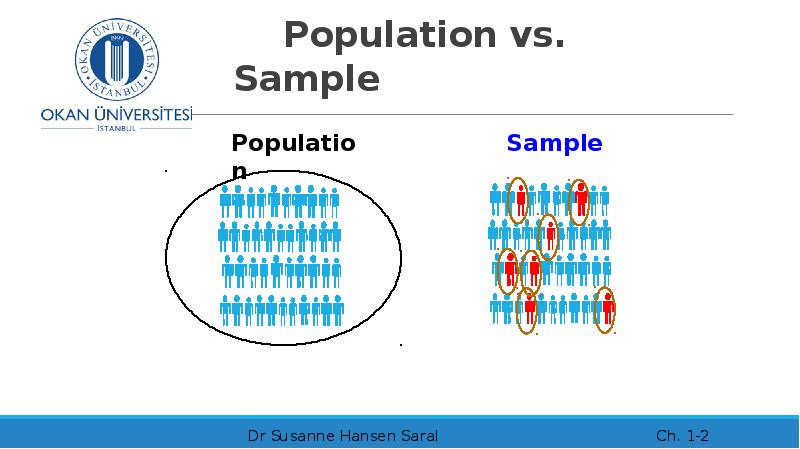
Population vs. Sample
Описание слайда:
Population vs. Sample

Слайд 3


Statistical key definitions POPULATION A population is the collection of all items of interest under investigation. N represents the population size...
Описание слайда:
Statistical key definitions POPULATION A population is the collection of all items of interest under investigation. N represents the population size Populations are usually very large, therefore it is impossible to investigate entire populations. It would be too Time consuming Costly

Слайд 4


Statistical key definitions SAMPLE A sample is an observed subset of the population n represents the sample size
Описание слайда:
Statistical key definitions SAMPLE A sample is an observed subset of the population n represents the sample size

Слайд 5


Statistical key definitions PARAMETER VS. STATISTICS A parameter is a specific characteristic of a population (mean, median, range, etc.) Example:...
Описание слайда:
Statistical key definitions PARAMETER VS. STATISTICS A parameter is a specific characteristic of a population (mean, median, range, etc.) Example: The mean (average) age of all students at OKAN A statistic is a specific characteristic of a sample (sample mean, sample median, sample range, etc.) Example: The mean (average) age of a sample of 500 students at OKAN

Слайд 6


Why do we collect samples instead of investigating the entire population? Populations usually are infinite and their parameters are rarely known. The...
Описание слайда:
Why do we collect samples instead of investigating the entire population? Populations usually are infinite and their parameters are rarely known. The only way we can find the estimated value of a population parameter is by collecting a sample from the population of interest.

Слайд 7


Why do we collect samples instead of investigating the entire population? Populations are usually infinite. Therefore impossible to investigate the...
Описание слайда:
Why do we collect samples instead of investigating the entire population? Populations are usually infinite. Therefore impossible to investigate the entire population Less time consuming to investigate a subset (sample) of the population than investigating the entire population. Timely delivery of the results. Less costly to administer, because workload is reduced It is possible to obtain statistical valid and reliable results based on samples.

Слайд 8


Randomness (Turkish: Rasgelelik) Our final objective in statistics is to make valid and reliable statements about the population based on sample...
Описание слайда:
Randomness (Turkish: Rasgelelik) Our final objective in statistics is to make valid and reliable statements about the population based on sample data. (inferential statistics) Therefore we need a sample that represents the entire population One important principle that we must follow in the sample selection process is randomness.

Слайд 9


Main sampling techniques Simple random sampling Systematic sampling Both techniques respect randomness and therefore provide reliable and valid data...
Описание слайда:
Main sampling techniques Simple random sampling Systematic sampling Both techniques respect randomness and therefore provide reliable and valid data for statistical analysis

Слайд 10


Random Sampling Simple random sampling is a procedure in which: Each member/item in the population is chosen strictly by chance Each member/item in...
Описание слайда:
Random Sampling Simple random sampling is a procedure in which: Each member/item in the population is chosen strictly by chance Each member/item in the population has an equal chance to be chosen Each member/item has to be independent from each other Every possible sample of n objects is equally likely to be chosen The resulting sample is called a random sample.

Слайд 11


Sampling error In statistics we make decision about a population based on sample data, because the population parameter is unknown. Ex. Elections...
Описание слайда:
Sampling error In statistics we make decision about a population based on sample data, because the population parameter is unknown. Ex. Elections Statisticians know that the sample statistic is rarely identical to the population parameter, but the two values are close. The difference between the sample statistic and the population parameter is called sampling error.

Слайд 12


Inferential statistics Drawing conclusion about a population based a sample information.
Описание слайда:
Inferential statistics Drawing conclusion about a population based a sample information.

Слайд 13


Inferential statistics To draw conclusions about the population based on a sample we need to collect data.
Описание слайда:
Inferential statistics To draw conclusions about the population based on a sample we need to collect data.

Слайд 14


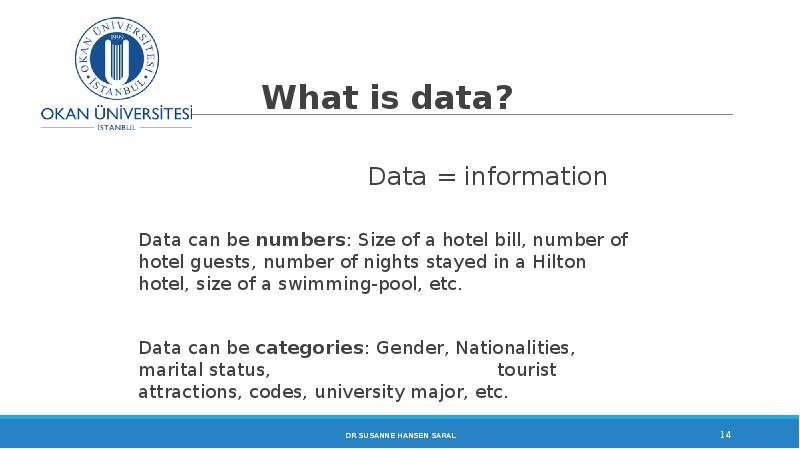
What is data? Data = information Data can be numbers: Size of a hotel bill, number of hotel guests, number of nights stayed in a Hilton hotel, size...
Описание слайда:
What is data? Data = information Data can be numbers: Size of a hotel bill, number of hotel guests, number of nights stayed in a Hilton hotel, size of a swimming-pool, etc. Data can be categories: Gender, Nationalities, marital status, tourist attractions, codes, university major, etc.

Слайд 15


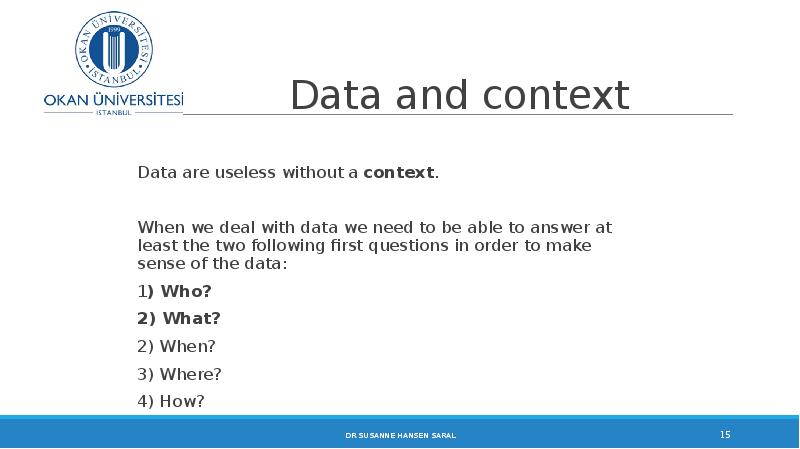
Data and context Data are useless without a context. When we deal with data we need to be able to answer at least the two following first questions...
Описание слайда:
Data and context Data are useless without a context. When we deal with data we need to be able to answer at least the two following first questions in order to make sense of the data: 1) Who? 2) What? 2) When? 3) Where? 4) How?

Слайд 16


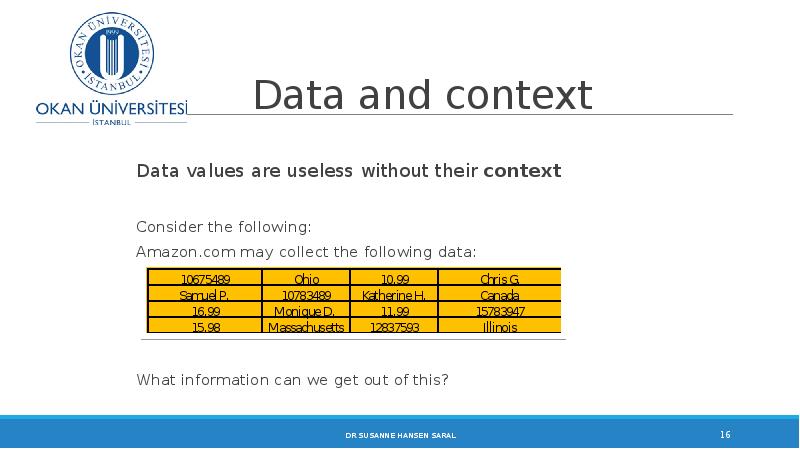
Data and context Data values are useless without their context Consider the following: Amazon.com may collect the following data: What information...
Описание слайда:
Data and context Data values are useless without their context Consider the following: Amazon.com may collect the following data: What information can we get out of this?

Слайд 17


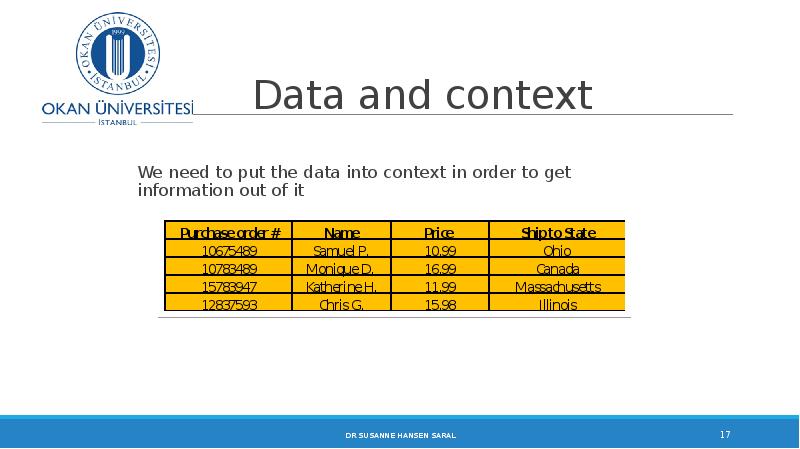
Data and context We need to put the data into context in order to get information out of it
Описание слайда:
Data and context We need to put the data into context in order to get information out of it

Слайд 18


What is statistics? It is a basic study of transforming data into information : how to collect it how to organize it how to summarize it, and finally...
Описание слайда:
What is statistics? It is a basic study of transforming data into information : how to collect it how to organize it how to summarize it, and finally to analyze and interpret it

Слайд 19


Where does data come from? Market research Survey (online questionnaires, paper questionnaires, etc.) Interviews Research experiments (medicine,...
Описание слайда:
Where does data come from? Market research Survey (online questionnaires, paper questionnaires, etc.) Interviews Research experiments (medicine, psychology, economics) Databases of companies, banks, insurance companies Internet other sources

Слайд 20


Descriptive Statistics Collect data e.g., Survey, interview Present data e.g., Tables and graphs Summarize data e.g., Sample mean =
Описание слайда:
Descriptive Statistics Collect data e.g., Survey, interview Present data e.g., Tables and graphs Summarize data e.g., Sample mean =

Слайд 21


Create your account in Khan Academy Go to create an account with your email address or your Facebook account (if you have one). Add me (Susanne...
Описание слайда:
Create your account in Khan Academy Go to create an account with your email address or your Facebook account (if you have one). Add me (Susanne Hansen Saral) as a coach: Follow the instructions from the hand-out

Слайд 22


PIAZZA.COM Piazza.com – class platform for: Posting class lectures, course syllabus, class announcement, youtube videos, etc.
Описание слайда:
PIAZZA.COM Piazza.com – class platform for: Posting class lectures, course syllabus, class announcement, youtube videos, etc.


Похожие презентации
Mypresentation.ru
Загрузить презентацию