Готовые презентации на тему:
- Образование
- Искусство и Фото
- Наши презентации
- Авто/мото
- Бизнес и предпринимательство
- Технологии
- Карьера
- Данные и аналитика
- Дизайн
- Устройства и комплектующие
- Экономика и Финансы
- Машиностроение
- Развлечения и Юмор
- Путешествия
- Eда
- Политика
- Юриспруденция
- Здоровье и Медицина
- Интернет
- Инвестиции
- Закон
- Стиль жизни
- Маркетинг
- Мобильные технологии
- Новости
- Недвижимость
- Рекрутинг
- Розничная торговля
- Таможня, ВЭД, Логистика
- Наука
- Услуги
- Программное обеспечение
- Спорт
- Музыка
- Шаблоны презентации
- Детские презентации
- Английский язык
- Астрономия
- Алгебра
- Биология
- География
- Геометрия
- История
- Литература
- Информатика
- Математика
- Обществознание
- Русский язык
- Физика
- Философия
- МХК
- ОБЖ
- Окружающий мир
- Педагогика
- Технология
- Химия
- Начальная школа
- Раскраски для детей
- Товароведение
- Менеджмент
- Страхование


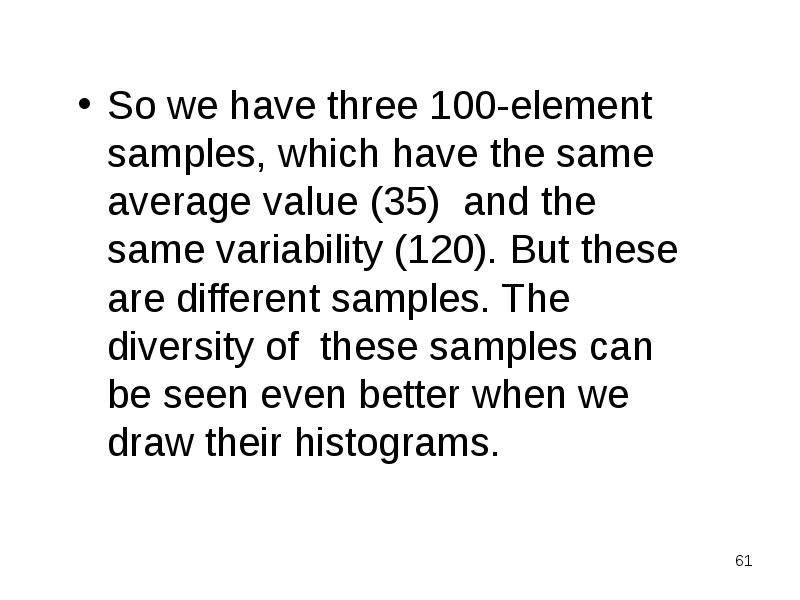


![I’d like to present [prI'zent] a project “The Influence of Geography on National Symbols”. I have chosen this topic because I find it interesting. I have always wanted to know what the symbols mean. In my project I am going to show how geographical features of Canada and the Commonwealth of Australia influence their national symbols.](/documents/1aa2931338f01af8d320902c510ca574/thumb.jpg)